
News
24 Jan 2021: The TBFY Interview
The TBFY project concluded on 31 December 2020. To mark the occasion, we look back at three years of hard work, take stock and discuss the future of procurement analytics to unlock data value chains. Read the full interview with the TBFY project team here.
15 Dec 2020: Publication of the TBFY White Paper on Publishing Procurement Data
The TBFY project partners are pleased to announce the publication of the White Paper on best practices in publishing open procurment data. The report, a copy of which can be found here, contains 10 pragmatic suggestions for making procurement data more accessible for the benefit of all.
1 Dec 2020: The TBFY Workshop on Data Governance for Public Procurement – From Principles to Practice
In December 2020, the TBFY team has published a white paper on data governance for public procurement. In order to discuss a draft version of the document with relevant stakeholders – and gather input for the final version – the project invited to an online seminar on November 25th.
The event was attended by more than 25 participants from 12 different member states, ranging from national ministries and procurement agencies to open data and transparency organisations, as well as businesses in the area of procurement.
The seminar started off with a series of short presentations. After a brief overview of the project, its goals and achievements by the project coordinator, Till Christopher Lech (SINTEF Digital), Ian MakGill (OpenOpps) outlined the vast potential for society and the economy that could be leveraged by better access to high quality procurement data. The main presentation was given by Prof. Oscar Corcho (UPM Madrid) laying out ten recommendations for publishing procurement data. Finally, Karolis Granickas (Open Contracting Partnership) put the TBFY project and the findings in the whitepaper draft in an international context, concluding with a call to action for better procurement data publication practices.
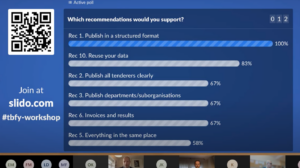
Figure 25: Screenshot of the interactive TBFY workshop on publication standards of procurement data on 25 November 2020.
The presentations were followed by a roundtable discussion, which was joined by Natalie Muric of the European Publications Office and Cécile Guasch, a consultant supporting the European ISA2 programme on the legal interoperability and eProcurement actions, started with an assessment of the recommendations put forward in the whitepaper draft.
While, undoubtedly, the recommendation to publish structured data according to standards was rated highest in the informal seminar poll, all recommendations were appreciated by the participants. Natalie Muric explained that the emerging eForms for tenders, once rolled out, will be a major step towards better, machine-readable data. However, publication of data such as contracts and invoices will remain at the discretion of the procuring agencies, as will the formats in which they publish data.
Karolis Granickas suggested that guidelines may be needed in order to ease the technical difficulties in publishing data. This point was supported by Till Lech, pointing out that data often resides in business systems not designed for exposing or sharing data. David Wysleciw (OpenNWT) mentioned that these systems are often outsourced to external parties who may not have Open Data principles very high on their agenda. The panel was in agreement on the fact that procurement agencies should include data publication into the functional requirements when purchasing procurement systems, an example of such requirements was provided by Karolis Granickas from the OCP.
Finally, the panel discussed the need for continuous R&D efforts and investments to build upon the results of projects such as TheyBuyForYou. Challenges regarding data quality, but also other data governance questions such as usage policies are still in the way of releasing the full potential of Big Data analytics and AI-techniques in public procurement.
The seminar was followed by a series of meetings with member states addressing the eProcurement Analytics Subgroup of the MULTI-STAKEHOLDER EXPERT GROUP ON ePROCUREMENT (EXEP), in an effort to disseminate the project and its results to member state stakeholders.
2 Oct 2020: How do people engage with data?
How do people choose, make sense of, and use data? Our friends over at the Data Stories project have put together a set of guidelines and recommendations as well as tools and technologies to help create stories with data.
Over the past three years, the project has been engaging with people from different backgrounds and professions to understand how they work with data. Their research clearly demonstrates that there is no one-size-fits-all approach: different stakeholders will have different expectations, attitudes and levels of competency when dealing with data. This is certainly true for complex procurement processes that engage public authorities, private businesses and competitors, all of whom will understand data differently. Check out the Data Stories video below for tips and tricks in designing your procurement processes more effectively.
3 Sep 2020: Detecting patterns and anomalies in spending data
Patterns in complex data such as public procurement are notoriously difficult to spot. As TBFY project partners, we have developed an approach which can help users identify and investigate recurrent behaviour in public spending data in order to uncover the dynamics of public spending and to spot regularities and anomalies in spending data. To do this, we have built the StreamStory tool, parts of which have also been modelled by JSI in other FP7 and H2020 research projects.
Public procurement and public spending usually evolve over time with some discernible pattern. That means, public spending data can be understood as event sequence data. StreamStory is designed to help users search for recurrent patterns by representing the data as a diagram of states and transitions, where recurrent patterns stand out visually.
To use the tool, we first have to prepare the data by extracting them from the Knowledge Graph and then turn them into appropriate feature vectors. This can be done through our web platform developed for the TheyBuyForYou project. Data is then imported into the StreamStory tool, which can detect structures and regularities within it.
Two examples: hospitals in Slovenia
In the following examples we are going to demonstrate how StreamStory, together with other tools developed for the TheyBuyForYou project can be used to explore the complexity of public procurement data in Slovenian hospitals.
We’ve selected all public procurement data from all Slovenian hospitals and exported them into a CSV file with sparse feature vectors using our web analytics platform. Data was imported into the StreamStory tool and we then built our model. For this model, we’ve used the following attributes: date of public procurement publication, criteria for selection, publication of tender in the EU, number of received bids, final value of the contract. The time unit is months, and time attributes were included in the model construction also. The number of states was set to 18.

Figure 1: The initial visualisation of the model.
In the tool, users can highlight different parameters. First, we’ve highlighted the final value of the contract. StreamStory recolours states in the central panel by the mean value of the highlighted attribute in each state – in our case the final value of the contract. This allows us to correlate the structure of the dataset with the final value of the contract. States with high average values are coloured orange while those with low values are coloured blue.

Figure 2: Revealed states with high final values of contracts.
The visualisation in Figure 2 shows the visual correlation of the structure of the dataset with the final value of the contract.
It clearly reveals one state (coloured orange), with the following average properties: criteria for selection was the price, tenders have been published in the EU, average number of received bids was 1 and the final value of the contract was 84.8 million EUR.

Figure 3: The most prevalent state in the “Slovenian hospitals” model.
Comparing with the most prevalent states shown in Figure 3, marked as “Criteria: price” (in Slovenian language: “Merila cena”), this state highly deviates from other states. This most prevalent state has the following average properties: criteria for selection was the price, tenders have not been published in the EU, average number of received bids was 2 and the final value of the contract was around 57,443 EUR.
Another most prevalent state, dubbed as “Published in EU: yes” also has a low number of bids. In that state, the criteria for selection were the price in 96% of cases, all tenders have been published in the EU, the average number of received bids was 1.7 and the final value of the contract was around 618,881 EUR.
Introducing further recolouring mechanisms based on selected attributes reveal another state (Figure 4), which plots final values of the contract above average. This state has the following average properties: criteria for selection was in 92% the price, all tenders have been published in the EU, the average number of received bids was 9.4 and the final value of the contract was around 25,1 million EUR.

Figure 4: State with the second highest average value of contracts.
The distribution of numbers of received bids shows that in general, hospitals in Slovenia only receive a low number of bids. This could be an indicator of low competition. However, this is not always the case. By selecting colouring based on this attribute – number of received bids – we can quickly spot one state, with an average number of 57,18 received bids (Figure 5). This state has the following average properties: criteria for selection was always the price, 82% of the tenders have been published in the EU and the final value of the contract was around 3,6 million EUR.
Adding to this, we can spot another two states with above average numbers of received bids, with the following properties: in the first, the criteria for selection were in all cases price, 85% of the tenders have been published in the EU, the average number of received bids was 32,2 and the final value of the contract was around 1,2 million EUR. In the second case, the criteria for selection were in all cases price, 79% of the tenders have been published in the EU, the average number of received bids was 16 and the final value of the contract was around 1,6 million EUR.

Figure 5: State with the highest average number of received bids.
The complexity and the vast amount of public procurement data means that patterns in that data are hard to spot even for people who have a solid background in data analytics. But searching for recurrent patterns and anomalies is much easier if these patterns stand out visually. The two examples above show how the StreamStory tool can help users identify and investigate recurrent behaviour in this data as it visually exposes interesting patterns and also provides automatically generated suggestions of possible interpretations and descriptions.
StreamStory has been designed to be easy to use. Admittedly, it does require appropriate preparation of input data (i.e. a transformation of the dynamic network into sparse feature vectors). Fortunately, the export function on our web analytics platform solves this problem. Together with our web analytics platform, StreamStory is a very useful tool for domain experts such as public procurement officials and decision makers, investigative journalists or other interested members of the public. StreamStory, together with our web analytics platform, can raise significantly levels of transparency and can help detect unwanted behaviour.
1 Aug 2020: The TBFY Knowledge Graph — Integrated and Open
The increasing amount of open procurement data enables us to analyse public spending to deliver better quality and more economical public services, prevent fraud and corruption, and build healthy and sustainable economies. In this respect, the TheyBuyForYou (TBFY) project aims at building a technology platform consisting of a set of modular web-based services and APIs, to publish, curate, integrate, analyse, and visualise an open, comprehensive, cross-border and cross-lingual procurement Knowledge Graph (KG), including public spending and corporate data from multiple sources across the European Union.
 Figure 1. Main concepts of the OCDS ontology.
We have integrated two high-quality datasets according to an ontology network, procurement (e.g., tenders and contracts) and company (i.e., legal entities) data, to form an interconnected knowledge graph for public procurement. The ontology network includes an ontology for representing procurement data based on Open Contracting Data Standard (OCDS)[1] and another ontology for representing company data, namely the euBusinessGraph ontology[2]. Figure 1 depicts the main concepts of the OCDS ontology, including entities such as contracting process, tender, and award.
Data is ingested from two main providers: OpenCorporates[3] for supplier data (i.e., company) and OpenOpps[4] for procurement data. OpenOpps has gathered over 3,000,000 tender documents from more than 685 publishers (worldwide) through web scraping and by using open APIs, while OpenCorporates currently has 140,000,000 entities collected from national registers. The data collected from OpenOpps and OpenCorporates is openly available under the Open Database License (ODbl)[5] on GitHub[6].
 Figure 2. TheyBuyForYou architecture.
The TheyBuyForYou architecture is depicted in Figure 2 including the data ingestion process for the KG. The data ingestion process comprises several steps using data APIs of both providers, including data curation (e.g., handling missing values and duplicates), matching suppliers appearing in tender data against canonical company records obtained from the OpenCorporates data set (i.e., reconciliation), and translating datasets into the underlying graph data representation (i.e., RDF) with respect to the ontology network. The current release of the Knowledge Graph (KG) covers data from January 2019 onwards. New data is onboarded every night. As of June 2020, the Knowledge Graph consists of more than 112 million triples (i.e., records) and contains information about 1,18 million tenders, 1,32 million awards and more than 90 thousand companies that have been matched to suppliers in awards.
The KG is available as open data. The data is available online and can be explored through several services. We also provide monthly data dumps of the KG. See http://data.tbfy.eu for more information.
| Service | URL | Description |
| KG SPARQL endpoint | http://data.tbfy.eu/sparql | SPARQL endpoint that allows users to query the KG using SPARQL. We are using Apache Jena Fuseki as the SPARQL server and Apache Jena TDB as the underlying database. |
| KG API | http://data.tbfy.eu/kg-api | REST API that allows you to query the KG. See https://github.com/TBFY/knowledge-graph-API/wiki for more info. |
| KG data dump | http://dump.tbfy.eu | Monthly data dump of the Knowledge Graph in RDF format containing procurement data and company data (for matching suppliers) for the period January 2019 onwards. In addition to the KG data dump in RDF, we have also made available the source data input for the KG, i.e., procurement release data from OpenOpps and company data (for matching suppliers) from OpenCorporates in JSON format. |
| YASGUI for KG | http://yasgui.tbfy.eu | YASGUI (Yet Another SPARQL GUI) is a 3rd party web application that we have set up that allows users to query the KG using SPARQL. |
The KG is available as open source software. All software components and ontologies developed in the TBFY project to create the Knowledge Graph have been released as open source on GitHub.
| Repository | URL | Description |
| Knowledge Graph (KG) | https://github.com/TBFY/knowledge-graph | Repository where all source code, information and documentation for creating, deploying and using the KG are found. |
| OCDS Ontology | https://github.com/TBFY/ocds-ontology | Repository for the OCDS ontology. |
| KG API | https://github.com/TBFY/knowledge-graph-API | Repository for the core API. It also contains the API documentation and SPARQL queries of the TheyBuyForYou project. |
| KG API Gateway | https://github.com/TBFY/api-gateway | Repository for the API Gateway. It provides a flexible abstraction layer and a single entry point that securely manages communication between TBFY clients and online tools via API. |
In addition to the KG and data ingestion components, we are developing a set of online toolkits including analytics components, such as a Cross-Lingual Search API[7]; anomaly detection components; a comprehensive set of guidelines for data visualisation and interaction design; and a design for a story-telling tool (see an overview here[8]). A series of real-life business cases being implemented on top of the knowledge graph and online tools offered by the platform. Do you want to explore TheyBuyForYou KG and platform? You can:
- follow the guidelines here to create a local test bed: https://github.com/TBFY/platform
- have an overview of all the platform components: https://tbfy.github.io/platform/
[1] https://standard.open-contracting.org
[2] https://github.com/euBusinessGraph/eubg-data
[3] https://opencorporates.com
[5] https://opendatacommons.org/licenses/odbl
[6] https://github.com/TBFY/data-sources
12 Jun 2020; Releasing the TBFY ecosystem, tools and services
In TheyBuyForYou we have been working on a layered architecture of data services, ontologies, core APIs and tools that allow different levels of access and use of our procurement knowledge graph. As shown in the figure, five main layers have been defined, those corresponding to data, tools, schemas, core APIs and added-value services that will be explained below.

Figure 1. TheyBuyForYou tools scheme
Data
In this bottom layer we can find the data that feeds both the knowledge graph and the document database. The knowledge graph data is obtained from the OpenOpps and OpenCorporates datasets and, through the data ingestion tool, they are transformed into RDF. The platform has the following data:
- TBFY knowledge graph: It is a database that contains the information about tenders, contracts, awards, organisations and contracting processes, used by the API Gateway.
- Document repository: It is a repository that contains all the legal documents, both the descriptions of the tenders and the JCR.
Schemas
This layer contains the vocabularies of our domain. These vocabularies are the intermediaries that get the knowledge graph to be understood with tools like SPARQL GUI or R4R. The platform has the following schemas:
- TBFY ontology: It imports the OCDS ontology (for procurement data) and the euBusinessGraph ontology (for company data). In addition, it contains a few extensions in order to represent additional meta information needed for the TBFY KG.
- euBusinessGraph ontology: It is an ontology for company data, originally developed in the euBusinessGraph project.
Tools
This layer contains tools built or used to create the Knowledge Graph and provide access to it. Among the types of tools, there are those tools that feed databases to those ones that query the TheyBuyForYou SPARQL endpoint. The platform has the following tools:
- Harvester: It downloads articles and legal documents from public procurement sources (OpenOpps, JRC-Acquis or TED) and indexes them into SOLR to allow performing complex queries and visualising results through Banana.
- R4R: It allows building and deploying RESTful services from SPARQL queries. The core API uses it to browse the TBFY knowledge graph.
- KG data ingestion pipeline: Data ingestion pipeline downloads OCDS releases in JSON format and reconciled supplier-company records in JSON format, enriches and transforms the data to RDF (using RML), and publishes the data to the TBFY KG database.
- SPARQL GUI for TBFY KG: It uses YASGUI (Yet Another SPARQL GUI), as a web application to query any SPARQL endpoint.
- OptiqueVQS: OptiqueVQS enables end users with no technical background and skills to transform their information needs into SPARQL queries visually.
Core APIs
This layer contains the set of core APIs built or used in the project. These core APIs are implemented with the basic resources to extract information from the knowledge graph, from the document repository or even from external data sources. The platform has the following core APIs:
- Knowledge graph API: It allows obtaining information about tenders, organisations, awards, contracts and contracting-processes from the RDF triple store.
- Public procurement OCDS API: It allows obtaining information about public procurement based on the OCDS standard, currently applied to the data from the Zaragoza City Council.
- OpenCorporates companies API: It provides access to data about 135 million companies from primary public sources.
- OpenCorporates reconciliation API: It allows OpenRefine users to match company names to legal corporate entities getting more information about companies.
- OpenOpps API: It provides access to tender and contract data from a range of European government bodies, formatting according to OCDS.
- librAIry API: it creates topic-based representations of documents (e.g., tenders) to relate them semantically.
- Wikifier Web service: It takes a text document as input and annotates it with links to relevant Wikipedia concepts.
Added-value services and tools
In this top layer we find non-basic services and tools, which go beyond standard ones and have extended features and add-ons to basic core functions. The platform has the following added-value services and tools:
- API Gateway: It provides a flexible abstraction layer and a single-entry point to manage the communication between TBFY clients and online tools.
- Search API: It explores collections of multilingual public procurement data through a Restful API.
- Storytelling: It is a client-side JavaScript framework designed for the purpose of supporting authors of data stories.
- Streamstory: It is a tool, which is intended to help with analysis and interpretation of time- varying data.
- Anomaly detection: It is an online toolkit exploring public spending and tender data and detecting anomalies in them.
- Average payment period to suppliers: It is an indicator that measures the delay in the payment of commercial debts in economic terms for entities associated to the Zaragoza city council.
- Compra Pública Inclusiva (COPIN): COPIN aims at providing better understanding on how public administrations specify and evaluate public tenders.
A simple usage example
María works in a Spanish company that sells office furniture and consumables. She wants to have access to public procurement data in Europe, since her company is planning to apply to a tender in the United Kingdom about “office furniture and consumables”. She wants to show to business managers at her company a report that includes all foreign companies that have been awarded in similar tenders.
María has several ways to solve this problem through the different services offered by the TheyBuyForYou platform. One way would be to use the Search API to find documents that contain “office furniture and consumables”.
(curl -X POST “https://tbfy.librairy.linkeddata.es/search-api/items” -H “accept: application/json” -H “Content-Type: application/json” -d “{ \”lang\”: \”en\”, \”size\”: 100, \”source\”: \”tender\”, \”terms\”: \”office furniture and consumables\”, \”text\”: \”office furniture and consumables\”}”)

 Once María has obtained the best scored documents, she obtains related tenders and contracting processes. To do this, she can use the knowledge graph API and obtain the tender and contracting process associated with each document. For example, the highlighted document (identifier ocds-0c46vo-0001-04f6012f-76e8-4095-b605-5a446ad0cad5_ocds-b5fd17-1273acb5-4a24-4274-b1e4-ba2ec108f5a8-escc—023858—award):

 Now, she has obtained the identifier of the related contracting process “ocds-0c46vo-0001-04f6012f-76e8-4095-b605-5a446ad0cad5”. Using this identifier in the knowledge graph API, the list of awards can be obtained:

 In this step, she obtains the identifier of the related award “ocds-0c46vo-0001-04f6012f-76e8-4095-b605-5a446ad0cad5_5bae0886-0c7d-4c11-8fb4-fb839aaf23b6”. Using this identifier in the knowledge graph API, the list of suppliers can be obtained:

 Finally, if she wanted more information from the awarded organisation (identifier gb-04082871), she may use again the knowledge graph API like this:

 This process can be repeated as many times as organisations need to be included in the report. And of course, the process is thought to be automated, by using or creating a customised added-value service that would execute all the operations described. For this example, the platform has example notebooks (e.g., the one described in [1]) of how to use all these resources.
More information about the catalogue of tools and links can be found at: https://tbfy.github.io/platform/
[1] https://colab.research.google.com/github/TBFY/api-gateway/blob/master/notebooks/similarity_organisations_ex.ipynb
30 Mar 2020: A new TBFY transparency tool for the Municipality of Zaragoza
Our project partners in Zaragoza have developed an exciting new transparency portal that uses TBFY technology to find and present spending and contract data in relation to the COVID-19 pandemic. In these exceptional times, many governments across the globe sadly have suspended open and transparent tendering. The Municipality of Zaragoza is leading by example in brushing against this trend. They’re making this data available for local citizens to find out where their money goes. You can find a link to the portal here:
https://www.zaragoza.es/sede/servicio/transparencia/1700
The page contains economic information and, more specifically, contracts and invoices that are related to COVID-19.

1 Mar 2020: Ensuring that public procurement is fair and just: An overview of SEPPAS – the Slovenian Ministry of Public Administration business case for TheyBuyForYou
What does SEPPAS stand for and what is our business case about?
SEPPAS stands for Slovenian Electronic Public Procurement Analysis Services and is centred around Slovenian public procurement data. The main focus is to detect corruption, searching for anomalies in the data to detect patterns that could indicate or fraud or otherwise suspicious activity.
Brief overview of the Slovenian economic environment
Slovenia has been a member of the EU since 2007 and has recorded very encouraging economic indicators in previous years. Annual GDP growth is hovering around 3,5-5% and was nominally around 48 billion EUR in 2019. The below figure indicates the volume of public procurement in the country since 2011.

What is the general idea and approach to our business case?
Slovenia has a useful collection of historic public procurement data that is being analysed within the scope of the TBFY project. Data is systematic and structured, so it is suitable for analysis and experimenting with new approaches to detect anomalies.
Slovenian Public Procurement is worth over 4.1bn EUR in terms of public procurement contracts annually and that is a significant part of public spending in Slovenia. Public procurement must be as transparent as possible and there are a number of rules and regulations in place to ensure all the proceedings meet the high standards of the Slovenian government.
One way to ensure standards are followed is to search for anomalies. Different approaches can be utilised in anomaly detection. One approach would be to feed all the data into a data analysis engine and run anomalies detection algorithms. This means that a very experienced public procurement professional will have to interpret the results that the algorithms produce to determine their usefulness. The second approach would be to set predetermined markers and then check for these results from the algorithmic output. What we propose is a hybrid of these two approaches where we set several indicators that are checked but we still allow the algorithm to run the data and display »red flags«. A skilled public procurement professional will still be needed to assess the importance of the outcomes and present them to the interested public.
What do we hope to gain from anomaly detection?
We hope our findings will help us improve the public procurement process in Slovenia and make it more transparent. The more transparent the process is, the more bidders we hope to attract so the more economically sound the whole procurement process becomes.
A recent World Bank study has found that an increase in the number of bidders yields significant savings in public procurement (in the range of 20%). With public procurement in Slovenia being worth more than 4.6bn EUR in 2018 this could mean savings in excess of 900m EUR.
We also envision linking our public procurement data with other public databases, thus improving transparency even further. Moreover, there are other tools being developed to further facilitate public procurement. One added benefit would be a tool that lets public procurement specialists know what to expect when preparing a bid. An example of such welcome information would be:
- the number of bids to expect (that would influence the choice of public procurement procedures to choose),
- an average distribution of bids,
- average decision time.
One tool being developed in this context is a decision tree which shows graphically the importance of parameters when conducting a public procurement procedure. It shows the factors which need to be implemented for maximizing the probability of success, defined as a procedure receiving a valid bid.

Of course, we always strive to acquire more than one valid bid as this shows the process is economically sound and that the procurement market is competing for business. To achieve this, our business case is also designed to detect collusion and other unfair practices. Agents might be unfairly coordinating their activities to influence the market which negates the basic principles of public procurement. These types of activities must be detected as soon as possible, and offenders prosecuted to the full extent of the law, barring their further cooperation in public procurement procedures.
Example: number of employees of a bidding party

One example of an analysis we consider in Figure 3 is the number of employees of a bidding organization and the value of a specific tender. The rationale here that it is unlikely to see high value tenders being won by a bidder with an abnormally low number of employees, which could indicate fraud. It does not automatically mean that there are unfair business practices behind this, however it does raise suspicion and warrants further investigation. Even more so if additional warning signs are also present, such as high occurrence of the same bidder winning tenders or if the same economic entity (or the owner) has faced criminal charges or sentences in other countries. Assessing this risk would obviously fall on an experienced public procurement specialist and involve specialized prosecution officers who are experts in economic criminal activities.
Our tools also help us focus on social considerations in the so-called Most Economically Advantageous Tender (MEAT) award criteria to foster sustainable public procurement. MEAT refers to awarding contracts on the basis of criteria other than price, such as social and environmental considerations and quality criteria. Social public procurement aims to increase the level of social criteria used in public procurement procedures. It may take into account a number of factors, such as:
- employment possibilities;
- adherence to labour standards;
- social inclusion of persons with disabilities and the elderly
- equal opportunities for men and women;
- promotion of permanent employment;
- social responsibility; and
- average salary of personnel.
Social criteria considerations in public procurement are an important aspect of public procurement and are specially regulated in Slovenian public procurement legislation. Beyond our work in anomaly detection, we are planning to use the tools developed in the TBFY project to monitor further the implementation of social criteria in public procurement.
Mitja Medvešček is Secretary of the Public Procurement Directorate at the Ministry of Public Administration in Slovenia.
3 Jan 2020: Showing where taxpayers’ money goes
Showing where taxpayers’ money goes: some guidelines on procurement data visualization
The European procurement market is a huge beast. In 2017, the total value of public purchases of goods and services across the European Union was estimated to be a whopping €2 trillion (or about 13% of GDP). Although the EU took significant steps in 2016 to open up the procurement market, it still recognizes that a lot of work remains to be done to level the playing field so that small and medium-sized enterprises (SMEs) can compete with big business for tenders in a fair and transparent fashion.
This transparency principle, a key element of a good democracy, demands that data related to taxpayers’ money should be as open as possible. Open data is good for everyone: only an economy that is open and fair can provide opportunities for new and small businesses. This is incredibly important as the best innovations often start small! Being life-long transparency advocates ourselves, we align with the OCP’s mission ‘to use the power of open data to save governments money and time and deliver better goods and services for citizens’. This is a big job which requires tackling the issue from multiple angles.
One way of bringing some well-needed transparency into the procurement market is to visualize who is doing what, when and how: where do public funds go and how are stakeholders connected? How have these networks evolved over time? Presenting this data in a concise manner is not just a way to uncover unrealized business opportunities but also helps detect patterns of collusion and corruption. Data visualization is a fantastic approach to make sense of data and to provide better insight into the complex world of procurement. But no one size fits all and for practitioners who work in the fields of open data, procurement and transparency it is important to sift through the good, the bad and the ugly.
So what are the principles of a good data visualization strategy? Here are some basics that any open data advocate and procurement professional should consider:
Be clear about what you want to communicate
If you work in the area of procurement, you’re likely to sit on tons of heterogeneous datasets. Your data is probably numerical (e.g. tender volume), related to time or categorical (e.g. sector of spending), and spatial (e.g. geographical coordinates). Not all of this data will be equally important for all of your stakeholders to see. And not all of your data will require visualization. The first step in getting your visualization strategy right is to think carefully about what users will want to see and what insight you wish to get across in the most efficient way.
Once you’ve worked out what data you want your stakeholders to consume, you should think of some appropriate analyses, statistics, indicators and aggregates that best summarize and communicate your data. You may wish to provide intel on how information about contract dates, volumes, etc. has evolved over time, or present a comparison between bidders and suppliers, or evaluate some KPIs, or show how data is geographically distributed. We recommend thinking about this carefully at the design stage. And consider how these variables hang together. A good data visualization strategy is clear about what it wants to achieve. Here are some examples of how a simple and clear message could be communicated visually:

Source: https://informationisbeautiful.net/beautifulnews/75-mobile-money/

Source: https://informationisbeautiful.net/beautifulnews/575-best-things-free/

Source: https://medium.com/@opencontracting/better-together-how-ugandans-are-improving-procurement-with-data-and-dialogue-3090ecaed857
Think about every element of your visualization design – it matters
Data visualizations are designed to make it easy to compare data or tell a story – both of which can help users to understand a topic and make decisions. This includes selecting a chart type that fits your data and the message you want to convey with and about your data. You will want to think about the graphical elements, who would see it and where (e.g. on a desktop browser or on small screens, such as a mobile device). But you will also need to think about the type of font you use, if you use icons or not, the colour choices and if they are readable but also if they convey a message. You should consider the axes and scales you use in the chart and how to label them. The issue of legends and annotations and whether people can actually read and make sense of what you created is important too. As is thinking about whether your users could face constraints, such as physical ones (e.g. colour blindness) or in terms of skills (e.g. avoid technical terms) or of bandwidth and screen size (e.g. avoid large charts that require scrolling or interactive visualizations that don’t convey the message when it does not load fast enough).
Avoid chart junk
Chart junk describes all visual elements in charts and graphs that are not necessary to comprehend the information on the graph, or that will otherwise distract the viewer from this information. This means avoiding graphical excesses that don’t ‘respect’ the data and the audience. The visual layout should help to deliver the message and should contain the minimum amount of elements on a chart necessary to achieve this. So when you have chosen the data, the message and a chart type, review the visualization and see if you can reduce unnecessary lines, background images or elements. You can use custom styles and shapes to make data easier to understand at a glance, in ways that suit users’ needs and context. Explain your charts, bars and indicators well, e.g. by labelling your axes clearly and to the right amount of detail – for instance by providing units of measurement. Think about the language your audience is most likely to understand and don’t forget that communicating things as easily as possible includes the largest range of users to consume your content. Avoiding unnecessary complex words is also a way to reduce chart junk.
Design a dashboard if your story is more complex
If you want to display a series of multiple charts you can design a dashboard. As we said before, you should keep your visualization as simple as possible. That’s why separate but connected charts can sometimes better tell a story than one complex chart. Dashboards are often used to monitor changes in data (for more guidance on dashboard design, see Stephen Few’s Information Dashboard Design). A good dashboard can contain different types of charts, such as bars, time series or indicators presented in an aesthetically pleasing way that strikes the right balance between keeping things tidy and simple but providing valuable insight (see https://datavizproject.com/ for an overview of the data visualizations commonly used for this purpose).
This means on a dashboard you’ll need to arrange your content in a meaningful and effective way. Prioritize the most important information using layout structures. Research that tracks how users navigate on a website has revealed that people associate different levels of relevance and importance depending on where content is located on a page. Users tend to pay more attention to the top-left and centre sections of a screen; your most important visualizations should go here. Material in the bottom-right corner, however, is often considered less relevant. Also make sure that items that are logically close to one another are in proximity on display too, e.g. avoid spreading spatial data all across the screen.
Here are some examples of dashboards for procurement data:

Caption: Example dashboard, Opening up Moldova’s contracts. Progress and challenges

Caption: Example dashboard, Better together: How Ugandans are improving procurement with data and dialogue
A lot more can be said about data visualization and we have compiled more detailed guidelines under https://theybuyforyou.eu/visualizationtool/guideline.html. In the next post we’ll provide an overview of the TheyBuyForYou tool that we’ve been working on as an example of how we have taken these guidelines to heart when working with procurement data.
Elena Simperl is Professor of Computer Science at King’s College London. She leads several projects on TheyBuyForYou, an EU-funded research consortium where she and her team built a cross-European knowledge graph of procurement data alongside a series of interfaces and tools that enable SMEs to realize new procurement opportunities. Elena is also the Principal Investigator of the Data Stories project that develops novel ways for citizens to engage with data in a post-truth society.
Laura Koesten is a researcher at King’s College London. She was a Marie Curie Skłodowska fellow at the Open Data Institute and at the University of Southampton, UK investigating the user perspective in dataset search. She is part of the TheyBuyForYou and the Data Stories project. In her research she is looking at ways to improve Human Data Interaction by studying sensemaking with data, data reuse and collaboration and human factors in data science.
21 Nov 2019: A free hand or a free market? How competitive is public procurement in Europe?
The most value for money in public procurement is linked to a competitive tendering process. This means encouraging multiple bidders to present offers. There are many ways to do this, all of which have a demonstrable effect on value for money of a purchase. In this series of articles, we will explore how competitive the overall public procurement tendering process is for European countries. Data was extracted from Tenders Electronic Daily or TED, one of the many data sources we use for tenders and contracts data. We looked at data over the past three financial years (FY), counted as between 1st April and 31st March.
This first part of a three-part series explores the average response time for tenders. In order to encourage more than just the incumbent supplier to bid, there needs to be enough time for any bidder to submit a suitable response. Failure to do so at best makes the process uncompetitive and at worst makes the process collusive.
Average response time for tenders (3 FY average)
The top five countries who provide the most time for bidders to respond are the Netherlands, Denmark, Serbia, the UK and Sweden.
| Country | Average response time | Trend | TED average |
| Netherlands | 77 days | +37% | 40 days |
| Denmark | 61 days | +33% | 40 days |
| Serbia | 50 days | +23% | 40 days |
| United Kingdom | 48 days | +33% | 40 days |
| Sweden | 45 days | +22% | 40 days |
All five countries have seen improvements over the past three financial years, that is to say the time for response is increasing. Meanwhile, the TED average stands at 40 days and is also improving. The top three: the Netherlands, Denmark and Serbia, are all significantly ahead of average at 77, 61, and 50 days respectively.
The averages for the top 5 are somewhat close to the TED average suggesting that the other side of the average provides between 35 and 40 days. The data generally supports this with only Malta, the lowest, falling outside of that window.
| Country | Average response time | Trend | TED average |
| Malta | 31 days | +11.5% | 40 days |
| Albania | 34 days | -14.3% | 40 days |
| Austria | 34 days | +3.3% | 40 days |
| Slovenia | 35 days | -6.5% | 40 days |
| Romania | 45 days | -1.3% | 40 days |
When we look at the bottom five, 3 have seen response times getting shorter and therefore worse over the past three years. By contrast the top 5 has seen double digit percentage improvement. There is grounds for optimism however: the lowest of the TED European countries, Malta, gives an average of 31 days to respond. This in itself is not generally an unreasonable period of time to respond to a call to tender.
To conclude, in this aspect, European countries on average provide at least a month to respond to tenders which is generally sufficient for all but the largest contracts. In the next part of the series, we’ll be looking at tenders with an abnormally low description and title, another key indicator of uncompetitive tenders.
You can find out more about our research at www.spendnetwork.com or look at our data at https://openopps.com.
Alex Yeung is Manager at OpenOpps and Spend Network. We manage the largest open database of over 20m procurement documents in the world mapped to a common standard (Open Contracting Data Standard). Our database is ever growing as we collect tens of thousands of procurement documents every day from hundreds of sources. We use this data to work with governments around the world to provide better value for money and outcomes for public procurement.
3 Oct 2019: Procurement data visualisation
Visualising the procurement data pipeline
The TBFY project has undertaken a detailed benchmark study of the state-of-the-art in procurement data visualisation. This study supports the front-end work that is carried out across several of the project’s main project themes. It aims to guide project partners in their choices of visualisation schemes based on their specific business cases and customer demands. In our study, we provide an overview of the exciting work that is being done in procurement analytics with a strong focus on end-user facing aspects, in particular visualisations. We aim to provide practical support regarding common challenges of presenting a complete, yet compact guide on data visualisation design from established theories and practices. The study also provides updates on the visualisation and interaction work done in the project overall.


What is the status quo in procurement data visualisation?
We have analysed 28 different data portals by starting our search from the website of Open Contracting Partnership (https://www.open-contracting.org/) and then iterated and expanded our search based on the results we found. Portals were designed for specific purposes based on their specific data requirements. Each portal we analysed focuses primarily on relatively few analyses. Some of the approaches under investigation (for example, tenders or contracts divided by different dimensions) are more popular than others and many portals have provided data visualisations to support them. For any type of analysis, several types of data visualisation techniques are available to best support the case.
How can the TBFY guidelines help you communicate insights better?
The TBFY team produces guidelines for project partners to identify the gaps between the analyses that their products support and those supported by the existing procurement data portals. In addition, project partners can use the data visualisation and interaction guidelines to review their current work. Outside the TBFY consortium, the review and guide that we’re putting together can be used as general instructions for dashboard design and for visualisation optimisation, especially in areas with strong focus in analytics.
1 Aug 2019: Business intelligence and blockchain in public tenders: efficiency, transparency and a boost for Spanish companies
At Oesía we believe that process reengineering is an essential pillar of the digital transformation that allows organizations to take full advantage of the potential of ICT for more efficient public services. In addition, process reengineering is a great opportunity to provide simpler and easier to understand public services that help bring administration closer to citizens. This redesign considers that the element of greatest value to an organization is the information available to it. Such an approach allows for better decisions to trigger actions, which requires laying the foundations of data-based processes. Once the information is contained in data, organizations can grow with Big Data, AI and Machine Learning tools. The aim is to automate certain decisions that will facilitate a more agile and rationalized Administration.
These approaches will become a trend in the coming years following a number of high-profile initiatives, such as the Directive (EU) 2019/1024 of the European Parliament, the Council of 20 June 2019 on open data and the re-use of public sector information, the Legislative Resolution of the European Parliament of 17 April 2019 on the regulatory proposal of the European Parliament and of the Council establishing the Digital Europe programme for the period 2021-2027 for the development of artificial intelligence, high performance computer science, cybersecurity and digital skills.
Within the Public Administration contracting context in Spain, with Law 9/2017, of November 8, on Contracts of the Public Sector, through which the European Parliament and Council Directives are transposed into Spanish law 2014/23 / EU and 2014/24 / EU, of February 26, 2014, the efforts are mainly aimed at providing greater transparency, requiring the publication of announcements in the Official Journal of the European Union, in addition to incorporating new options to automate and simplify the public contracting process and introducing new concepts such as the electronic fingerprinting of offers.

This technology and legal framework has generated many opportunities for both public administration and private companies.
In this spirit, Oesía is developing the business case COPIN (Compra Pública Inclusiva, in English Inclusive Public Purchase) as part of TBFY. We are creating a web platform to provide information and analytics of tenders among the EU. The main purposes are:
- To help public administrations improve their efficiency in their procurement processes and results. The information provided will allow a better understanding of the specific markets and communicate how other administrations specify and evaluate similar tenders. Additionally, the platform will provide analytics to help transparency policies of the institutions.
- To support public administration and associations of enterprises, a tool for providing companies tender information with strong searching and analysis capabilities will be made available. This is expected to impact small enterprise business opportunities in particular. While large companies can absorb the cost of seeking and applying for tenders, SMEs are typically locked out of markets, simply due to the high cost of finding the right information. Likewise, SME and large companies can boost sales and extend presence in foreign markets. They can also have the opportunity to connect with other companies and join efforts to present an offer.


For Oesía, this business case means to improve the current offer of ICT services and products designed to empower public administration management, procurement, online services and public policies.
Outside of TBFY but regarding the procurement process, as a case of innovative use, Oesía can provide real experience in the production of public contracting services based on blockchain. In particular, we have developed the service of distributed registry of tender offers and their automated evaluation for the Government of Aragon. With this project, the Government of Aragon aims to explore and take advantage, through a concept test in production, of all the advantages that the Distributed Ledger Technology (DLT) may carry in the field of administrative management and in the concrete application in the relationship with the agents involved in the hiring process, such as bidding companies and citizens. This provides the maximum guarantee of independence, security and transparency, as well as elements that provide a true differential value compared to other technologies – particularly regarding the immutability of records, management based on the identity of private data and the traceability of the entire process.
In addition, this blockchain based project helps to obtain valuable information about the true potential of the DLT with a general perspective. Its application, which is certainly novel today in any field of management, is revealing a whole set of technological or legislative challenges, but at the same time it is enabling us to understand its transformative capacity in a public administration that strives to provide better services that are more efficient, accessible and transparent.
Oesía Networks
15 Jul 2019: ENABLING PROCUREMENT DATA VALUE CHAINS THROUGH A KNOWLEDGE GRAPH-BASED PLATFORM
LAUNCH OF THE TBFY KNOWLEDGE GRAPH
We are happy to announce the first release of the knowledge graph for public procurement, integrating tender and company data.
Public procurement affects organisations across all sectors. With tenders amounting close to 2 trillion euros annually in the EU, it is critical that this market operates fairly and efficiently, supporting competitiveness and accountability. Data-driven insights can help make this happen, supporting buyers and suppliers alike in their procurement decisions.
TheyBuyForYou OCDS ontology visualized with the Protege OntoGraph plugin:

TheyBuyForYou is a three-year initiative bringing together researchers, innovators and public administrations from 5 European countries. It is supported by EU H2020. The aim of the programme is to make procurement data more easily accessible and hence facilitate better decisions in areas such as economic development, demand management, competitive markets and vendor intelligence. To achieve this, TheyBuyForYou leverages a range of data sources which are integrated into a knowledge graph, which is used in data analytics and decision making.
Almost eighteen months into the programme, the team is proud to announce their first release of the TheyBuyForYou knowledge graph, integrating tender and company data. As of the first quarter of 2019, the graph consists of over 23 million triples (records), covering information about almost 220,000 tenders.
The knowledge graph is available as open source and is compatible with standards in the procurement domain:
- OCDS (Open Contracting Standard), capturing tender data throughout the contracting process.
- euBG ontology, developed by the European euBusinessGraph project, providing a common model for company data.
The graph capitalises on data from two market leaders in their fields: OpenCorporates (for company data), and OpenOpps (for tenders and contracts, including the Tenders Electronic daily – TED – data feed).
Dr. Ahmet Soylu, SINTEF Digital (technical manager):
“Government spending processes need data and tools that enable transparent decision making. The TheyBuyForYou knowledge graph constitutes an important step in the right direction and may become the core model for future procurement data ecosystems.”
Prof Oscar Corcho, Universidad Politécnica de Madrid (knowledge engineering expert):
“Governments and public entities must deliver transparent services in the face of reduced budgets, while preventing losses through fraud and corruption. The TheyBuyForYou knowledge graph provides an appropriate response to these challenges.”
Dr. George Konstantinidis, University of Southampton (data management expert):
“Managing, integrating, interacting with and providing analytics on top of procurement data is dependent upon reliable and well-designed data infrastructure. The TheyBuyForYou knowledge graph is a coordinated effort to achieve these goals.”
Ian Makgill, OpenOpps (govtech entrepreneur):
“We are very happy to see our data feeds and APIs integrated in the TheyBuyForYou knowledge graph. We hope that more data providers and consumers will adopt this technology, which can become an extremely useful channel to reach new customers and develop business models for procurement related data assets.”
Prof Elena Simperl, University of Southampton (knowledge engineering expert):
“Knowledge graphs bring together data from a variety of sources into a common format that can be easily extended and reused by organisations. By releasing the graph open source we hope to encourage developers to use it in their own products and give us feedback on how we could improve it.”
Find the knowledge graph at https://github.com/TBFY/knowledge-graph
1 May 2019: TBFY First Hackathon – Alan Turing Institute in London, 8-12 April 2019
The TBFY project partners held their first hackathon at the prestigious Alan Turing Institute in London in early April 2019. The hackathon was run by a wide range of leading academics from the University of Southampton, the University of Manchester and the University of Oxford, among others. Spend Network provided access to hundreds of thousands of tender notices from the UK and overseas to give researchers the opportunity to explore ways of matching businesses to government contract opportunities. It is one of TBFY’s key objectives to make the procurement market more accessible and more transparent, which made this a particularly exciting event.
The project partners invited programming wizards with skills in text mining, natural language processing, recommender systems, modelling with structured data records, semi-supervised learning, dashboard visualization and familiarity with EU or UK tenders to this one-week event in central London.
The approach that the team decided to pursue consisted of building vector representations of suppliers and tenders to identify their compatibility with the distance between the respective vectors. In building their representations, our data specialists made use of both their textual descriptions and knowledge of previously awarded contracts.
One of the key outcomes of the experiments over the week is that previous contracts are informative of future procurement decisions. This demonstrates just how important transparency and openness are for the tender and procurement process. The best results of the week-long efforts used correlated topic models for extracting representations of textual descriptions.
Yuchen Zhao from the University of Southampton represented the TBFY community at this hackathon and contributed a full report for the Alan Turing Institute which can be found here.
19 Mar 2020: Public International Trade Opportunities: How OpenOpps is making data more accessible for you
At OpenOpps, we have been working with our partners They Buy For You on an exciting new Public International Trade Opportunities (IPTO) project. The outcome of this project is to provide a single point of access for data, available to people all around the world.
The first stage is to manage the data that will be used as an input for the enrichment and publication process in future stages of IPTO.
We began this work in a strong position, with a database containing tender notices and contract data from across Europe, mapped to the Open Contracting Data Standard format. But we wanted to do more…
Redesigning the way we collect our data
To improve the reliability of our data collection, we have redesigned our scripts. We programmed code that collects new publications from websites publishing contracts and tenders. Now they can run independently from each other, decreasing the chances of failure across the data collection process.
In addition, this improves our ability to log the activities of our scripts. Now, for each source, we have a far better understanding of how our data collection efforts are running and performing.
Consequently, our new collection methods mean we can now offer partners an online tool to monitor script outputs every day.
Expand our data sources
Working in partnership, OpenOpps and our partners at TBFY have identified key data sources from around Europe. After assessing their suitability for the project, we created accurate scripts to collect data from these. Now we have data for Spain, Italy, the UK and France.
We have also redesigned how we process data from TED, a website dedicated to European tenders and procurement, and our contract collection scripts for TED. Following this, we can now collect even more data formats, without missing any nested contracts, multiple contracts awarded against a single tender.
At the end of this first stage of the project, we have successfully expanded the data collection required for the project. We now publish daily, on average, more than 26,000 tenders from Europe, over 200% more than our previous data gathering.
The future…
Still we want to do more. We want to keep expanding the number of data sources and to be able to better evaluate economic development opportunities from public procurement. In short, we want to keep opening up public procurement, to make it more accountable, better value for money and ultimately, fairer.
For more about Open Procurement Europe.
28 Jan 2019: Optimise your vendor management process
Cerved is an Italian leader in business information, and a truly data driven company – our data patrimony enables us to offer high added value services to our clients. Some of our core businesses include credit information, ensuring protection of businesses against credit risks, as well as marketing solutions offering new business opportunities to companies.
Recent innovations in digital transformation have greatly influenced the purchasing division of companies with requirements to further increase efficiency in managing supplier portfolios. The first key step in successful supplier management includes knowing your suppliers (i.e. financial stability, ancienty, the workforce, existing insolvencies, amongst others). Cerved with its rich data patrimony, continuous new data sourcing, integration and harmonisation, and growing ecosystem of APIs is well placed to answer this need for the Italian market.

In the scope of TheyBuyForYou Cerved is developing various indicators for supplier risk monitoring as supplier stability is crucial for the vetting and procurement decision process. To this end Cerved is relaying on it’s rich data patrimony including procurement notices data. Cerved is also developing a set of services that can be easily integrated in 3rd-party supplier monitoring and spend management solutions. These include:
Supplier profile enrichment
Providing rich profiles for the tender participating companies, including their main business, products, website, past tender history, dimensions, revenue, entities, territory presence and employees.
Risk Mitigation
Identifying potential collusive tendering by discovering hidden connections between several participating companies within a tender call. We rely on large databases of proprietary Chamber of commerce data, collected open data including historical tender information and third-party data sources. Existing links between company shareholders and managers are cross-matched with links between companies, sharing properties and tender co-participation.
Ranking
Procurement managers might have different preferences for ranking potential suppliers. This ranking might not only be based on the price – they might be more interested in financial stability and other dimension for ensuring robust supply chains or in the geographical position for logistics. This service will support supplier ranking based on various indicators, such as the innovation capacity of the company, website visibility, underlying website technology, dimensionality, news presence, amongst others.
Supplier Discovery
Frequently buyers are not happy with how the existing suppliers are answering their e-procurement needs. This service will propose and offer information on potential suppliers that could answer the e-procurement need based on co-participation in past tenders, website content, as well as other indicators.

28 Jan 2019: Making a business case for reconciliation

Knowing who we and our governments do business with matters. In most developed countries, government procurement is a fairly hidden process. This lack of oversight isn’t just a problem in terms of access to information – it also excludes small businesses from the procurement process, distorting the market against them..
In order to understand a company – for procurement or other purposes – businesses and organisations often need more information about entities than what is available in company registers. This means enriching this information with data from other sources. Doing so is actually a lot more difficult than you might imagine. For example, is OpenCorporates Ltd the same as OpenCorporates Limited? Doing this across jurisdictions is even more tricky. This process of matching references to companies to canonical records of them is known as ‘reconciliation’, or ‘entity resolution’.
For example, an SEC 10-K filing (an annual report with a comprehensive summary of a company’s financial performance) may include information about the company’s subsidiaries, and perhaps jurisdictions. In order to be useful, users need to be able to match the information in this non-company register data to the 160 million plus companies in OpenCorporates.
Whether you are a stakeholder of a company, a financial services company, a start up, a public sector body, a journalist, NGO, corporate investigator or law enforcement, easily finding references to companies and matching these against the legal entity is crucial.
OpenCorporates already has this functionality via our OpenRefine API – but we want to make this faster, add more functionality, and improving the matching. We’re carrying this out as part of our work with the EU Horizon 2020 project TheyBuyForYou. We will be enhancing our reconciliation service using both some simple improvements, alongside advanced technologies. We’ll be blogging more about this as the project progresses.
Amongst the areas we’ll be looking at will be matching against additional attributes such as addresses, handling abbreviations, punctuation and typos, and creating a new scoring mechanism for matches, and allowing users to configure the strength weighting to different pieces of data e.g. placing more weight on company number. We’re also OpenCorporates committed to increasing the number of EU Member States for which we have company register data.
The end goal is that reconciliation will be transparent, user friendly and matches will be made against open, clean and quality assured OpenCorporates data.

28 Jan 2019: Public International Trade Opportunities: An OpenOpps Project
What is ‘Public International Trade Opportunities’?
‘Public International Trade Opportunities’ (PITO) represents our vision to open up global public sector tenders and contracts of world. We want to provide access to this information to taxpayers, suppliers, journalists, government organisations, NGOs and academic bodies around the world.
‘Public International Trade Opportunities’ in practice
At OpenOpps we currently collect over 26,000 tender documents a month from over 720 different public sources around the world, without any need for human intervention.
We collect data from over 100 countries, gathering their tender notices, contract notices and specification documents. These documents are all converted by us to the Open Contracting Data Standard JSON format (OCDS). At the time of writing we have over 10.3m documents in our database, making it the largest OCDS repository in the world.
By turning this data into a collective register of government demands across the globe, we know what is bought by whom.
Our product; your product
We make open tenders freely available to search through our website https//:openopps.com, at the time of writing you can search over 100,000 open tenders through our site. All of our data is also available through our API. We also have a subscription web service that provides advanced search, additional data and downloads.
How we get the data and what we do with it

Our technologies
The technologies that we use are open source, including our database, search engine, web framework and charting tools, so they can be deployed without limitation.
Where we sit in ‘They Buy For You’
Our data is trusted by our partners in ‘They Buy For You’ (part of the European Commission’s Horizon 2020 program): OESIA, Cerved, UPM, SOTON, JSI and MJU and underpins the program as a whole. Our data is also being used by the UK Government, the European Union and multiple blue chip companies. We are also working with Academic institutions, including the Alan Turing Institute.
7 Sep 2018: Why are public tenders becoming less competitive?
Worrying new research by TBFY partner Openopps, shows that public tenders across Europe are becoming increasingly uncompetitive, with 25% of tenders receiving only one bid. Of concern is that the trend toward uncompetitive single-bid tenders is increasing – by 44% between 2016 and 2017. The total estimated value of these uncompetitive contracts has grown from €41trn to more than €100trn* in the same period.

Falling bids, average bid numbers for tenders across Europe. (Source: data extracted from ted.europa.eu).
The lack of competition is also shown by the average number of bids being posted by suppliers for each contract. In 2012, the average number of bids for each tender was nearly four, in 2018 the average number of bids has been less than three, a fall of 27%. While this may appear to be good news for lone bidders, uncompetitive tendering does not deliver good value for consumers, and is a possible indicator of cronyism.
But why are we seeing this movie from highly competitive towards less competitive tenders?
We don’t yet know, but a significant ambition at TheyBuyForYou is to apply cutting-edge analysis and to open procurement data to gain improved insight into underlying causes of this and other undesirable supply chain phenomena. With greater computing power available to us, we’re able to draw correlations between low numbers of bids and key attributes of the tenders being published.
For instance, we already know that there is an inverse correlation between the falling average number of bids and an increase in the value of a contract (see chart below). However this correlation is less pronounced than we would expect. We also see a similar inverse correlation between the number of single bids and the value of a contract.

Average numbers of bids by thresholds of contract value, 2012 – 2018. (Source: data extracted from ted.europa.eu)
Future analysis could look at whether the amount of work required to respond to a tender is a factor, or whether the quality of the language used in tender documents correlates to poor response rates. We will also look at the timings of tender responses, looking not just at the time provided to respond to tenders but also when tenders are published, such as during popular holidays like Christmas.
This is just the very beginning of our research, our aim is to use the data that we gather to highlight where problems are occurring and suggest remedies that European governments may adopt to improve their procurement. From clear insights on how to attract suppliers to bids and potentially providing early warning of bids that may prove to be uncompetitive, we aim to provide a suite of tools and mechanisms that will improve the efficiency of public markets across Europe.
However, the data we can extract from these public notices is often poor and data on contracting is particularly inconsistent. In order to develop the tools that can resolve some of these pressing issues, we will have to undertake significant work on improving and augmenting this data. Our aim is to apply improved analytical techniques to not only understand what is driving the rising lack of competition, but also to provide Governments with tools and analytics that will reverse that trend.
For further information on this issue please see OpenOpps founder, Ian Makgill’s blog post.
* All analysis was conducted using the TED data (ted.europa.eu).
31 Aug 2018: Oesía: helping to boost the impact of SMEs

Some of the Information Society publications and analysis supported by Oesía.
Through their significant role in developing public administration services Oesía are closely aligned with Spanish government initiatives to boost the economic development and competitiveness of micro, small and medium enterprises (SMEs) through adoption of new technologies. It is this unique insight that Oesía bring to our project. Their key role will be to contribute their considerable technology and know-how to develop, evaluate and promote the Inclusive Public Purchase information platform. This is one of the key deliverables of our project which we expect to have a significant impact on the development of SMEs as well as public administrations.
Opening tenders to SMEs
While large companies can absorb the cost of seeking and applying for tenders, SMEs are typically locked out of markets, simply due to the high cost of finding the right information. To counter this, our platform will provide access to European public tenders via a single website, allowing everyone to search for proposals. This ground-breaking approach will enable fair and equitable access to public content providing immense economic and social benefit to all – from large, multinational businesses, to the smallest SME.
A key benefit to larger companies that currently hire information services will be the ability to access public tender opportunities in a more centralised, focused way. By incorporating new search capacities, including the adoption of knowledge graphs, ontologies, and open data, our platform enables the highest possible specificity of requirements and conditions. Among other features, our platform will also facilitate potential collaborations between SMEs and larger companies, thereby enabling optimal combinations of offers. In short, a clear impact is expected on the inclusion of the SME in public procurement processes, resulting in global economic development.
From the point of view of public administrations, the Inclusive Public Purchase platform, will add depth to our understanding of markets through the analysis of awarded contracts and their specifications. This will result in better purchasing decisions and increased efficiency in public management while also improving transparency and access to open data, thereby contributing to the impact of SMEs.
In addition to developing the Inclusive Public Purchase platform, Oesía are also bringing their substantial knowledge and experience to the development of our Spanish public sector business cases (Work Package 6), and will provide IT services and consultancy to our exploitation strategy (Work Package 7).
About Oesía
Oesía enterprise are part of Group Oesía, a leading Spanish technology company offering IT consultancy and managed services. Evolving from the foundation of Technobit, in 1976, and headquartered in Madrid, Group Oesía is a large company established throughout Spain and 23 other countries, employing a staff of more than 3,000 worldwide.

Regional government tender and electronic auction portal, developed with OESIA’s @djudica platform.
The public sector consultant team at Oesía specialise in public procurement, open government, cyber security, innovation, economic management, administrative procedure, regulation, legislation, and European funds management. They lead services and development of a variety public administration services, including Interpública (since 1995, they have provided public administration accounting and transparency services for more than 1200 municipalities), the @djudica tender and electronic auction portal, and the citizen participation platform, NEXO.

NEXO platform: OESIA’s product for citizen participation.
The background to Oesía’s participation to our project was through their development of a Contracting Ontology for the public sector – part of the Spanish governments’ CONTSEM Project (Optimization of public procurement through the use of semantic techniques). The result of this experience was the PPROC ontology, which is used in their bidding processes by Huesca County Council, the Government of Aragón, as well as other public institutions including fellow TheyBuyForYou project partners Zaragoza City Council. PPROC is also the ontology recommended by AENOR in the UNE 178301 Smart Cities standard: Open Data.
Oesía’s Office of Evaluation and Studies has carried out evaluations and impact assessments of various public programs included in the Digital Agenda for Spain. Many of them were associated with Objective 2: developing the digital economy for growth, competitiveness and internationalisation of Spanish companies. These activities are undertaken by the Public Business Entity Red.es, and are aimed at micro enterprises and SMEs.
These businesses are based on ICT (Information and Communication Technology) advice, e-commerce, digital marketing, connectivity, cloud computing, management systems and equipment, amongst others. including public programs aimed at enhancing both the supply and the demand for ICT in SMEs. The encounter between ICT supply and demand for sustainability and the digital transformation of SMEs is considered a key factor. In this sense, actions that facilitate bringing the demand of the public sector closer to SMEs, such as the TheyBuyForYou project, will generate a pull effect on the supply of SMEs, enhancing their growth.
In the line of good practices for ICT public policies in Spain, it is worth noting the leading role of Red.es in developing impact evaluations of its programs to understand the degree of compliance with the set objectives. This is done in order to understand the efficiency and effectiveness of its actions, and to improve the design and execution of future programs.
Oesía have been engaged with the efforts of public administration and SMEs to increase core ICT competencies and bridge technological gaps, with the ultimate goal of growing and promoting Spain’s economic development. This is especially important when we take into consideration that most Spanish business are SME’s with fewer than 200 employees. Oesía’s support of ONTSI (The National Observatory for Telecommunications and the Information Society) in monitoring the use of ICT by Spanish companies, has allowed them to develop a deep understanding of the barriers and opportunities that arise for these enterprises.
14 Aug 2018: Best practices in public procurement: open data and transparency at Zaragoza City Council

Plaza del Pilar, Zaragoza/Gregorio Puga Bailón/ ©2015. CC BY 2.0
Project partners, Zaragoza City Council are at the forefront of publishing and managing open data on public procurement, and are working towards full electronic management of public contracts. Their involvement with They Buy For You includes:
- Improving the visualisation of public procurement
- Defining a dashboard
- Improving performance in detecting data errors, and combating fraud.
For more than 10 years Zaragoza CC have published tender calls, award notices and contract notices on its Buyers Profile web site. As early as 2008 they adopted advanced methods, like time stamping – ensuring access, integrity, availability, authenticity, confidentiality, traceability and data preservation. In recent years they have published more in-depth contract data on the site, including information from Minor Contracts.
Open Public Contracting Data

Catalogue of Open Data, Zaragosa City Council ©2018
Zaragoza CC coordinates the Public Procurement Working Group of the W3C Spain Open Data community. Since 2013 the Council has worked closely with similar and like-minded organisations to establish agreed protocols on the publication of its Buyers Profile dataset. In order to encourage reuse of their datasets by businesses, citizens, and other stakeholders, it was agreed to adopt open data standards, as well as systematic monitoring of public procurement, and the development of studies.
Access to the catalogue of open data allows citizens to find out how to reuse information. It includes examples of SPARQL queries, access to the ontology, and other useful guidance.
An ontology for public procurement
Since 2015, all the contracts managed by the City Council have been labeled semantically, using the PPROC ontology. This includes minor, open and negotiated contracts, both for work and services and supplies. These contracts can be consulted through the Buyers Profile and through Zaragoza’s open data catalogue, in different formats.
Current services
Contracts
Spanish procurement law requires the publication of announcements and specifications related to a tender exclusively on its Public Sector Contracting Platform. This means that only a link to the platform is published on the Zaragoza CC.
Latest Updates
Direct access to different announcements are available in chronological order.
Contracts Search
Access and filter current and historical tenders, by contract status, record, contracting entity, type of contract (work, service, supply), among other criteria.
![]()
Transparency Indicators, Zaragosa City Council ©2018
- Awardees
Successful companies that have participated Zaragoza City Council’s call for tenders since 2014. - Bidders
A list of companies that have participated in tendering processes. A page for each company is shown, indicating the number of contracts that have been tendered, the amount obtained and the breakdown by years. - Management services
A list of Management Services for the contracts formalised by the Zaragoza City Council. - Data totals
Amount and percentage of formalised contracts, and steps followed by a formalised contract.
Automatic updates in the Spanish Platform for Public Contracting
Zaragoza CC has mapped PPROC contracts with CODICE (the set of XSD schemes used by the Spanish Public Sector Contracting Platform) in accordance with the procedures and requirements of Directives 2014/23/EU; 2014/24/EU; 2014/25/EU; 2009/81/CE and the Spanish regulations on public procurement.
Next steps
The They Buy For You project enables Zaragosa CC to continue to develop their services, with the following objectives:
Improving existing services for the visualisation of public procurement.
Enriching information on contracts through the use of services developed in this project, and making the most of the project partners’ experience to improve the user experience of these visualisations. In this way, Zaragosa CC will be able to reduce the time/effort required to solve public information requests, optimise the economic proposals of the tenderers, and facilitate the analysis of contract costs.
Defining a dashboard – with indicators related to contracting, economic information provided by project partners and improving transparency.
Developing services for our departments that assist their contract supervision and management work. This will be achieved by producing technical reports which focus on the fight against fraud, quality of data (error detection), and ultimately, improving efficiency.
1 Jun 2018: TBFY partners gather

TBFY partners enjoy the spring sunshine between workshop sessions at Bled, Slovenia.
As our project continues to build momentum we gathered for our second plenary meeting on the 8th and 9th May in Bled, Slovenia. Our agenda focused on progress made over the first 4 months of They Buy For You and plans for next steps. We’ve achieved some key milestones so far. These include scoping procurement open data sources and APIs, collecting information to create engaging business cases, and developing data visualisations. So far we have identified around 150 relevant data sources which will be extracted, normalised and ingested into our developing toolset over the coming months.
See our Twitter story on Wakelet.
 It’s still early days, but significant progress has been made, with partners are set to meet again in mid-September in Spain. To follow daily updates on the many aspects of our project, including our developing knowledge graph, how we manage datasets in different languages, and contracting data, please visit and connect to our Github repository.
They Buy For You is an EU Horizon2020 project using open data to build tools for better and fairer procurement, with the aim of stimulating growth in European data companies, saving €billions in public spending, and combating corruption in the tendering process.
20 May 2018: Safety in procurement

Procurement is a huge business which affects virtually all sectors and organisations. In the public sector alone, spending on goods and services across the EU is estimated at more than €2 trillion per year.
But there are many challenges. Governments and state-owned enterprises are confronted must deliver services with greatly reduced budgets; prevent losses through fraud and corruption; and build healthy, sustainable economies. Managing these competing priorities at a national level and across many disparate agencies is notoriously difficult. Coordinating them across Member States seems almost impossible, and the development of vibrant, competitive economies without access to data and tools is problemmatic.
In times of enhanced transparency and accountability, there is a pressing need for better insight into, and management of government spending. Too often, the same suppliers are given contracts without considering the total, longer-term benefits to the government’s bottom line or the broader implications of tendering decisions in terms of employment and skills development. At the same time, we struggle to identify fraud in public tendering; the OECD estimates that more than 82% of these cases remain undetected across all OECD countries, while recent research puts the costs of corruption in EU public tendering as high as €990b a year.
Private sector procurement faces similar challenges. Decision makers are expected to deliver the best possible value and to run efficient and accountable tendering procedures, whether the beneficiaries are company shareholders or taxpayers. While the process tends to be less structured than in the public sector and decisions and framework conditions are not subject to public scrutiny. However, these decisions should be transparent internally, and they should demonstrate best value for money. Facilitating this becomes increasingly difficult as the global flows of goods, services, finances, and people reach levels unimagined a few decades ago.
In this environment, They Buy For You are using open data to build tools for better and fairer procurement. Over the coming years we aim to assist SME’s and public organisations, stimulate the growth of data companies, save €billions in public spending, and help to combat corruption in the tendering process.
30 Apr 2018; Innovation scenarios, business cases and objectives
TheyBuyForYou explores how procurement and public spending data, paired with data management, analytics, and interaction design, can be used to innovate four main areas:
- Economic development: Delivering better economic outcomes from public spending, in particular for SMEs. SMEs should be able to get better access to public tenders, competing with more established players.
- Demand management: Spotting trends in spending and supplier management to achieve long term goals such as cost savings and efficiency gains.
- Competitive markets: Identifying areas for cost cuts through healthier competition.
- Procurement intelligence: Producing advanced analytics to inform decision support, risk monitoring and supply market analysis for procurement and purchasing managers.
To achieve this we are building a new technology platform using public spending and corporate data from a wide range of sources in Europe. Our platform comprises Web-based services and APIs that will publish, curate, integrate, analyse, and visualise a comprehensive, cross-border and cross-lingual procurement knowledge graph.
We are also supporting our four innovation scenarios through the building of an online toolkit and a public portal. This will enable everyone – suppliers, buyers, data journalists, data analysts, public authorities and all citizens – to explore and understand how public procurement decisions affect economic development, efficiencies, competitiveness and supply chains.
For private buyers looking to overhaul their procurement and purchasing decisions, we will deliver vendor intelligence solutions with advanced analytics capabilities. These will provide the ability to monitor risk, support decision making, and identify potential collusive tendering.
Our technical vision will be realised in three business cases, aimed at the main customers for procurement services. Two business cases will be with public administrations at the national and local levels in Spain and Slovenia. These will demonstrate how new data value chains can make processes more efficient, while in the same time fostering economic development and restoring fairness and true competition in the supply market. The third business case will result in a new commercial product, developed by TBFY partner Cerved, for decision makers in procurement and supplier management.
2 Oct 2020: How do people engage with data?
How do people choose, make sense of, and use data? Our friends over at the Data Stories project have put together a set of guidelines and recommendations as well as tools and technologies to help create stories with data.
Over the past three years, the project has been engaging with people from different backgrounds and professions to understand how they work with data. Their research clearly demonstrates that there is no one-size-fits-all approach: different stakeholders will have different expectations, attitudes and levels of competency when dealing with data. This is certainly true for complex procurement processes that engage public authorities, private businesses and competitors, all of whom will understand data differently. Check out the Data Stories video below for tips and tricks in designing your procurement processes more effectively.
3 Sep 2020: Detecting patterns and anomalies in spending data
Patterns in complex data such as public procurement are notoriously difficult to spot. As TBFY project partners, we have developed an approach which can help users identify and investigate recurrent behaviour in public spending data in order to uncover the dynamics of public spending and to spot regularities and anomalies in spending data. To do this, we have built the StreamStory tool, parts of which have also been modelled by JSI in other FP7 and H2020 research projects.
Public procurement and public spending usually evolve over time with some discernible pattern. That means, public spending data can be understood as event sequence data. StreamStory is designed to help users search for recurrent patterns by representing the data as a diagram of states and transitions, where recurrent patterns stand out visually.
To use the tool, we first have to prepare the data by extracting them from the Knowledge Graph and then turn them into appropriate feature vectors. This can be done through our web platform developed for the TheyBuyForYou project. Data is then imported into the StreamStory tool, which can detect structures and regularities within it.
Two examples: hospitals in Slovenia
In the following examples we are going to demonstrate how StreamStory, together with other tools developed for the TheyBuyForYou project can be used to explore the complexity of public procurement data in Slovenian hospitals.
We’ve selected all public procurement data from all Slovenian hospitals and exported them into a CSV file with sparse feature vectors using our web analytics platform. Data was imported into the StreamStory tool and we then built our model. For this model, we’ve used the following attributes: date of public procurement publication, criteria for selection, publication of tender in the EU, number of received bids, final value of the contract. The time unit is months, and time attributes were included in the model construction also. The number of states was set to 18.
Figure 1: The initial visualisation of the model.
In the tool, users can highlight different parameters. First, we’ve highlighted the final value of the contract. StreamStory recolours states in the central panel by the mean value of the highlighted attribute in each state – in our case the final value of the contract. This allows us to correlate the structure of the dataset with the final value of the contract. States with high average values are coloured orange while those with low values are coloured blue.
Figure 2: Revealed states with high final values of contracts.
The visualisation in Figure 2 shows the visual correlation of the structure of the dataset with the final value of the contract.
It clearly reveals one state (coloured orange), with the following average properties: criteria for selection was the price, tenders have been published in the EU, average number of received bids was 1 and the final value of the contract was 84.8 million EUR.
Figure 3: The most prevalent state in the “Slovenian hospitals” model.
Comparing with the most prevalent states shown in Figure 3, marked as “Criteria: price” (in Slovenian language: “Merila cena”), this state highly deviates from other states. This most prevalent state has the following average properties: criteria for selection was the price, tenders have not been published in the EU, average number of received bids was 2 and the final value of the contract was around 57,443 EUR.
Another most prevalent state, dubbed as “Published in EU: yes” also has a low number of bids. In that state, the criteria for selection were the price in 96% of cases, all tenders have been published in the EU, the average number of received bids was 1.7 and the final value of the contract was around 618,881 EUR.
Introducing further recolouring mechanisms based on selected attributes reveal another state (Figure 4), which plots final values of the contract above average. This state has the following average properties: criteria for selection was in 92% the price, all tenders have been published in the EU, the average number of received bids was 9.4 and the final value of the contract was around 25,1 million EUR.
Figure 4: State with the second highest average value of contracts.
The distribution of numbers of received bids shows that in general, hospitals in Slovenia only receive a low number of bids. This could be an indicator of low competition. However, this is not always the case. By selecting colouring based on this attribute – number of received bids – we can quickly spot one state, with an average number of 57,18 received bids (Figure 5). This state has the following average properties: criteria for selection was always the price, 82% of the tenders have been published in the EU and the final value of the contract was around 3,6 million EUR.
Adding to this, we can spot another two states with above average numbers of received bids, with the following properties: in the first, the criteria for selection were in all cases price, 85% of the tenders have been published in the EU, the average number of received bids was 32,2 and the final value of the contract was around 1,2 million EUR. In the second case, the criteria for selection were in all cases price, 79% of the tenders have been published in the EU, the average number of received bids was 16 and the final value of the contract was around 1,6 million EUR.
Figure 5: State with the highest average number of received bids.
The complexity and the vast amount of public procurement data means that patterns in that data are hard to spot even for people who have a solid background in data analytics. But searching for recurrent patterns and anomalies is much easier if these patterns stand out visually. The two examples above show how the StreamStory tool can help users identify and investigate recurrent behaviour in this data as it visually exposes interesting patterns and also provides automatically generated suggestions of possible interpretations and descriptions.
StreamStory has been designed to be easy to use. Admittedly, it does require appropriate preparation of input data (i.e. a transformation of the dynamic network into sparse feature vectors). Fortunately, the export function on our web analytics platform solves this problem. Together with our web analytics platform, StreamStory is a very useful tool for domain experts such as public procurement officials and decision makers, investigative journalists or other interested members of the public. StreamStory, together with our web analytics platform, can raise significantly levels of transparency and can help detect unwanted behaviour.
1 Aug 2020: The TBFY Knowledge Graph — Integrated and Open
The increasing amount of open procurement data enables us to analyse public spending to deliver better quality and more economical public services, prevent fraud and corruption, and build healthy and sustainable economies. In this respect, the TheyBuyForYou (TBFY) project aims at building a technology platform consisting of a set of modular web-based services and APIs, to publish, curate, integrate, analyse, and visualise an open, comprehensive, cross-border and cross-lingual procurement Knowledge Graph (KG), including public spending and corporate data from multiple sources across the European Union.
Figure 1. Main concepts of the OCDS ontology.
We have integrated two high-quality datasets according to an ontology network, procurement (e.g., tenders and contracts) and company (i.e., legal entities) data, to form an interconnected knowledge graph for public procurement. The ontology network includes an ontology for representing procurement data based on Open Contracting Data Standard (OCDS)[1] and another ontology for representing company data, namely the euBusinessGraph ontology[2]. Figure 1 depicts the main concepts of the OCDS ontology, including entities such as contracting process, tender, and award.
Data is ingested from two main providers: OpenCorporates[3] for supplier data (i.e., company) and OpenOpps[4] for procurement data. OpenOpps has gathered over 3,000,000 tender documents from more than 685 publishers (worldwide) through web scraping and by using open APIs, while OpenCorporates currently has 140,000,000 entities collected from national registers. The data collected from OpenOpps and OpenCorporates is openly available under the Open Database License (ODbl)[5] on GitHub[6].
Figure 2. TheyBuyForYou architecture.
The TheyBuyForYou architecture is depicted in Figure 2 including the data ingestion process for the KG. The data ingestion process comprises several steps using data APIs of both providers, including data curation (e.g., handling missing values and duplicates), matching suppliers appearing in tender data against canonical company records obtained from the OpenCorporates data set (i.e., reconciliation), and translating datasets into the underlying graph data representation (i.e., RDF) with respect to the ontology network. The current release of the Knowledge Graph (KG) covers data from January 2019 onwards. New data is onboarded every night. As of June 2020, the Knowledge Graph consists of more than 112 million triples (i.e., records) and contains information about 1,18 million tenders, 1,32 million awards and more than 90 thousand companies that have been matched to suppliers in awards.
The KG is available as open data. The data is available online and can be explored through several services. We also provide monthly data dumps of the KG. See http://data.tbfy.eu for more information.
| Service | URL | Description |
| KG SPARQL endpoint | http://data.tbfy.eu/sparql | SPARQL endpoint that allows users to query the KG using SPARQL. We are using Apache Jena Fuseki as the SPARQL server and Apache Jena TDB as the underlying database. |
| KG API | http://data.tbfy.eu/kg-api | REST API that allows you to query the KG. See https://github.com/TBFY/knowledge-graph-API/wiki for more info. |
| KG data dump | http://dump.tbfy.eu | Monthly data dump of the Knowledge Graph in RDF format containing procurement data and company data (for matching suppliers) for the period January 2019 onwards. In addition to the KG data dump in RDF, we have also made available the source data input for the KG, i.e., procurement release data from OpenOpps and company data (for matching suppliers) from OpenCorporates in JSON format. |
| YASGUI for KG | http://yasgui.tbfy.eu | YASGUI (Yet Another SPARQL GUI) is a 3rd party web application that we have set up that allows users to query the KG using SPARQL. |
The KG is available as open source software. All software components and ontologies developed in the TBFY project to create the Knowledge Graph have been released as open source on GitHub.
| Repository | URL | Description |
| Knowledge Graph (KG) | https://github.com/TBFY/knowledge-graph | Repository where all source code, information and documentation for creating, deploying and using the KG are found. |
| OCDS Ontology | https://github.com/TBFY/ocds-ontology | Repository for the OCDS ontology. |
| KG API | https://github.com/TBFY/knowledge-graph-API | Repository for the core API. It also contains the API documentation and SPARQL queries of the TheyBuyForYou project. |
| KG API Gateway | https://github.com/TBFY/api-gateway | Repository for the API Gateway. It provides a flexible abstraction layer and a single entry point that securely manages communication between TBFY clients and online tools via API. |
In addition to the KG and data ingestion components, we are developing a set of online toolkits including analytics components, such as a Cross-Lingual Search API[7]; anomaly detection components; a comprehensive set of guidelines for data visualisation and interaction design; and a design for a story-telling tool (see an overview here[8]). A series of real-life business cases being implemented on top of the knowledge graph and online tools offered by the platform. Do you want to explore TheyBuyForYou KG and platform? You can:
- follow the guidelines here to create a local test bed: https://github.com/TBFY/platform
- have an overview of all the platform components: https://tbfy.github.io/platform/
[1] https://standard.open-contracting.org
[2] https://github.com/euBusinessGraph/eubg-data
[3] https://opencorporates.com
[5] https://opendatacommons.org/licenses/odbl
[6] https://github.com/TBFY/data-sources
12 Jun 2020; Releasing the TBFY ecosystem, tools and services
In TheyBuyForYou we have been working on a layered architecture of data services, ontologies, core APIs and tools that allow different levels of access and use of our procurement knowledge graph. As shown in the figure, five main layers have been defined, those corresponding to data, tools, schemas, core APIs and added-value services that will be explained below.
Figure 1. TheyBuyForYou tools scheme
Data
In this bottom layer we can find the data that feeds both the knowledge graph and the document database. The knowledge graph data is obtained from the OpenOpps and OpenCorporates datasets and, through the data ingestion tool, they are transformed into RDF. The platform has the following data:
- TBFY knowledge graph: It is a database that contains the information about tenders, contracts, awards, organisations and contracting processes, used by the API Gateway.
- Document repository: It is a repository that contains all the legal documents, both the descriptions of the tenders and the JCR.
Schemas
This layer contains the vocabularies of our domain. These vocabularies are the intermediaries that get the knowledge graph to be understood with tools like SPARQL GUI or R4R. The platform has the following schemas:
- TBFY ontology: It imports the OCDS ontology (for procurement data) and the euBusinessGraph ontology (for company data). In addition, it contains a few extensions in order to represent additional meta information needed for the TBFY KG.
- euBusinessGraph ontology: It is an ontology for company data, originally developed in the euBusinessGraph project.
Tools
This layer contains tools built or used to create the Knowledge Graph and provide access to it. Among the types of tools, there are those tools that feed databases to those ones that query the TheyBuyForYou SPARQL endpoint. The platform has the following tools:
- Harvester: It downloads articles and legal documents from public procurement sources (OpenOpps, JRC-Acquis or TED) and indexes them into SOLR to allow performing complex queries and visualising results through Banana.
- R4R: It allows building and deploying RESTful services from SPARQL queries. The core API uses it to browse the TBFY knowledge graph.
- KG data ingestion pipeline: Data ingestion pipeline downloads OCDS releases in JSON format and reconciled supplier-company records in JSON format, enriches and transforms the data to RDF (using RML), and publishes the data to the TBFY KG database.
- SPARQL GUI for TBFY KG: It uses YASGUI (Yet Another SPARQL GUI), as a web application to query any SPARQL endpoint.
- OptiqueVQS: OptiqueVQS enables end users with no technical background and skills to transform their information needs into SPARQL queries visually.
Core APIs
This layer contains the set of core APIs built or used in the project. These core APIs are implemented with the basic resources to extract information from the knowledge graph, from the document repository or even from external data sources. The platform has the following core APIs:
- Knowledge graph API: It allows obtaining information about tenders, organisations, awards, contracts and contracting-processes from the RDF triple store.
- Public procurement OCDS API: It allows obtaining information about public procurement based on the OCDS standard, currently applied to the data from the Zaragoza City Council.
- OpenCorporates companies API: It provides access to data about 135 million companies from primary public sources.
- OpenCorporates reconciliation API: It allows OpenRefine users to match company names to legal corporate entities getting more information about companies.
- OpenOpps API: It provides access to tender and contract data from a range of European government bodies, formatting according to OCDS.
- librAIry API: it creates topic-based representations of documents (e.g., tenders) to relate them semantically.
- Wikifier Web service: It takes a text document as input and annotates it with links to relevant Wikipedia concepts.
Added-value services and tools
In this top layer we find non-basic services and tools, which go beyond standard ones and have extended features and add-ons to basic core functions. The platform has the following added-value services and tools:
- API Gateway: It provides a flexible abstraction layer and a single-entry point to manage the communication between TBFY clients and online tools.
- Search API: It explores collections of multilingual public procurement data through a Restful API.
- Storytelling: It is a client-side JavaScript framework designed for the purpose of supporting authors of data stories.
- Streamstory: It is a tool, which is intended to help with analysis and interpretation of time- varying data.
- Anomaly detection: It is an online toolkit exploring public spending and tender data and detecting anomalies in them.
- Average payment period to suppliers: It is an indicator that measures the delay in the payment of commercial debts in economic terms for entities associated to the Zaragoza city council.
- Compra Pública Inclusiva (COPIN): COPIN aims at providing better understanding on how public administrations specify and evaluate public tenders.
A simple usage example
María works in a Spanish company that sells office furniture and consumables. She wants to have access to public procurement data in Europe, since her company is planning to apply to a tender in the United Kingdom about “office furniture and consumables”. She wants to show to business managers at her company a report that includes all foreign companies that have been awarded in similar tenders.
María has several ways to solve this problem through the different services offered by the TheyBuyForYou platform. One way would be to use the Search API to find documents that contain “office furniture and consumables”.
(curl -X POST “https://tbfy.librairy.linkeddata.es/search-api/items” -H “accept: application/json” -H “Content-Type: application/json” -d “{ \”lang\”: \”en\”, \”size\”: 100, \”source\”: \”tender\”, \”terms\”: \”office furniture and consumables\”, \”text\”: \”office furniture and consumables\”}”)
Once María has obtained the best scored documents, she obtains related tenders and contracting processes. To do this, she can use the knowledge graph API and obtain the tender and contracting process associated with each document. For example, the highlighted document (identifier ocds-0c46vo-0001-04f6012f-76e8-4095-b605-5a446ad0cad5_ocds-b5fd17-1273acb5-4a24-4274-b1e4-ba2ec108f5a8-escc—023858—award):
Now, she has obtained the identifier of the related contracting process “ocds-0c46vo-0001-04f6012f-76e8-4095-b605-5a446ad0cad5”. Using this identifier in the knowledge graph API, the list of awards can be obtained:
In this step, she obtains the identifier of the related award “ocds-0c46vo-0001-04f6012f-76e8-4095-b605-5a446ad0cad5_5bae0886-0c7d-4c11-8fb4-fb839aaf23b6”. Using this identifier in the knowledge graph API, the list of suppliers can be obtained:
Finally, if she wanted more information from the awarded organisation (identifier gb-04082871), she may use again the knowledge graph API like this:
This process can be repeated as many times as organisations need to be included in the report. And of course, the process is thought to be automated, by using or creating a customised added-value service that would execute all the operations described. For this example, the platform has example notebooks (e.g., the one described in [1]) of how to use all these resources.
More information about the catalogue of tools and links can be found at: https://tbfy.github.io/platform/
[1] https://colab.research.google.com/github/TBFY/api-gateway/blob/master/notebooks/similarity_organisations_ex.ipynb
30 Mar 2020: A new TBFY transparency tool for the Municipality of Zaragoza
Our project partners in Zaragoza have developed an exciting new transparency portal that uses TBFY technology to find and present spending and contract data in relation to the COVID-19 pandemic. In these exceptional times, many governments across the globe sadly have suspended open and transparent tendering. The Municipality of Zaragoza is leading by example in brushing against this trend. They’re making this data available for local citizens to find out where their money goes. You can find a link to the portal here:
https://www.zaragoza.es/sede/servicio/transparencia/1700
The page contains economic information and, more specifically, contracts and invoices that are related to COVID-19.
1 Mar 2020: Ensuring that public procurement is fair and just: An overview of SEPPAS – the Slovenian Ministry of Public Administration business case for TheyBuyForYou
What does SEPPAS stand for and what is our business case about?
SEPPAS stands for Slovenian Electronic Public Procurement Analysis Services and is centred around Slovenian public procurement data. The main focus is to detect corruption, searching for anomalies in the data to detect patterns that could indicate or fraud or otherwise suspicious activity.
Brief overview of the Slovenian economic environment
Slovenia has been a member of the EU since 2007 and has recorded very encouraging economic indicators in previous years. Annual GDP growth is hovering around 3,5-5% and was nominally around 48 billion EUR in 2019. The below figure indicates the volume of public procurement in the country since 2011.
What is the general idea and approach to our business case?
Slovenia has a useful collection of historic public procurement data that is being analysed within the scope of the TBFY project. Data is systematic and structured, so it is suitable for analysis and experimenting with new approaches to detect anomalies.
Slovenian Public Procurement is worth over 4.1bn EUR in terms of public procurement contracts annually and that is a significant part of public spending in Slovenia. Public procurement must be as transparent as possible and there are a number of rules and regulations in place to ensure all the proceedings meet the high standards of the Slovenian government.
One way to ensure standards are followed is to search for anomalies. Different approaches can be utilised in anomaly detection. One approach would be to feed all the data into a data analysis engine and run anomalies detection algorithms. This means that a very experienced public procurement professional will have to interpret the results that the algorithms produce to determine their usefulness. The second approach would be to set predetermined markers and then check for these results from the algorithmic output. What we propose is a hybrid of these two approaches where we set several indicators that are checked but we still allow the algorithm to run the data and display »red flags«. A skilled public procurement professional will still be needed to assess the importance of the outcomes and present them to the interested public.
What do we hope to gain from anomaly detection?
We hope our findings will help us improve the public procurement process in Slovenia and make it more transparent. The more transparent the process is, the more bidders we hope to attract so the more economically sound the whole procurement process becomes.
A recent World Bank study has found that an increase in the number of bidders yields significant savings in public procurement (in the range of 20%). With public procurement in Slovenia being worth more than 4.6bn EUR in 2018 this could mean savings in excess of 900m EUR.
We also envision linking our public procurement data with other public databases, thus improving transparency even further. Moreover, there are other tools being developed to further facilitate public procurement. One added benefit would be a tool that lets public procurement specialists know what to expect when preparing a bid. An example of such welcome information would be:
- the number of bids to expect (that would influence the choice of public procurement procedures to choose),
- an average distribution of bids,
- average decision time.
One tool being developed in this context is a decision tree which shows graphically the importance of parameters when conducting a public procurement procedure. It shows the factors which need to be implemented for maximizing the probability of success, defined as a procedure receiving a valid bid.
Of course, we always strive to acquire more than one valid bid as this shows the process is economically sound and that the procurement market is competing for business. To achieve this, our business case is also designed to detect collusion and other unfair practices. Agents might be unfairly coordinating their activities to influence the market which negates the basic principles of public procurement. These types of activities must be detected as soon as possible, and offenders prosecuted to the full extent of the law, barring their further cooperation in public procurement procedures.
Example: number of employees of a bidding party
One example of an analysis we consider in Figure 3 is the number of employees of a bidding organization and the value of a specific tender. The rationale here that it is unlikely to see high value tenders being won by a bidder with an abnormally low number of employees, which could indicate fraud. It does not automatically mean that there are unfair business practices behind this, however it does raise suspicion and warrants further investigation. Even more so if additional warning signs are also present, such as high occurrence of the same bidder winning tenders or if the same economic entity (or the owner) has faced criminal charges or sentences in other countries. Assessing this risk would obviously fall on an experienced public procurement specialist and involve specialized prosecution officers who are experts in economic criminal activities.
Our tools also help us focus on social considerations in the so-called Most Economically Advantageous Tender (MEAT) award criteria to foster sustainable public procurement. MEAT refers to awarding contracts on the basis of criteria other than price, such as social and environmental considerations and quality criteria. Social public procurement aims to increase the level of social criteria used in public procurement procedures. It may take into account a number of factors, such as:
- employment possibilities;
- adherence to labour standards;
- social inclusion of persons with disabilities and the elderly
- equal opportunities for men and women;
- promotion of permanent employment;
- social responsibility; and
- average salary of personnel.
Social criteria considerations in public procurement are an important aspect of public procurement and are specially regulated in Slovenian public procurement legislation. Beyond our work in anomaly detection, we are planning to use the tools developed in the TBFY project to monitor further the implementation of social criteria in public procurement.
Mitja Medvešček is Secretary of the Public Procurement Directorate at the Ministry of Public Administration in Slovenia.
3 Jan 2020: Showing where taxpayers’ money goes
Showing where taxpayers’ money goes: some guidelines on procurement data visualization
The European procurement market is a huge beast. In 2017, the total value of public purchases of goods and services across the European Union was estimated to be a whopping €2 trillion (or about 13% of GDP). Although the EU took significant steps in 2016 to open up the procurement market, it still recognizes that a lot of work remains to be done to level the playing field so that small and medium-sized enterprises (SMEs) can compete with big business for tenders in a fair and transparent fashion.
This transparency principle, a key element of a good democracy, demands that data related to taxpayers’ money should be as open as possible. Open data is good for everyone: only an economy that is open and fair can provide opportunities for new and small businesses. This is incredibly important as the best innovations often start small! Being life-long transparency advocates ourselves, we align with the OCP’s mission ‘to use the power of open data to save governments money and time and deliver better goods and services for citizens’. This is a big job which requires tackling the issue from multiple angles.
One way of bringing some well-needed transparency into the procurement market is to visualize who is doing what, when and how: where do public funds go and how are stakeholders connected? How have these networks evolved over time? Presenting this data in a concise manner is not just a way to uncover unrealized business opportunities but also helps detect patterns of collusion and corruption. Data visualization is a fantastic approach to make sense of data and to provide better insight into the complex world of procurement. But no one size fits all and for practitioners who work in the fields of open data, procurement and transparency it is important to sift through the good, the bad and the ugly.
So what are the principles of a good data visualization strategy? Here are some basics that any open data advocate and procurement professional should consider:
Be clear about what you want to communicate
If you work in the area of procurement, you’re likely to sit on tons of heterogeneous datasets. Your data is probably numerical (e.g. tender volume), related to time or categorical (e.g. sector of spending), and spatial (e.g. geographical coordinates). Not all of this data will be equally important for all of your stakeholders to see. And not all of your data will require visualization. The first step in getting your visualization strategy right is to think carefully about what users will want to see and what insight you wish to get across in the most efficient way.
Once you’ve worked out what data you want your stakeholders to consume, you should think of some appropriate analyses, statistics, indicators and aggregates that best summarize and communicate your data. You may wish to provide intel on how information about contract dates, volumes, etc. has evolved over time, or present a comparison between bidders and suppliers, or evaluate some KPIs, or show how data is geographically distributed. We recommend thinking about this carefully at the design stage. And consider how these variables hang together. A good data visualization strategy is clear about what it wants to achieve. Here are some examples of how a simple and clear message could be communicated visually:
Source: https://informationisbeautiful.net/beautifulnews/75-mobile-money/
Source: https://informationisbeautiful.net/beautifulnews/575-best-things-free/
Source: https://medium.com/@opencontracting/better-together-how-ugandans-are-improving-procurement-with-data-and-dialogue-3090ecaed857
Think about every element of your visualization design – it matters
Data visualizations are designed to make it easy to compare data or tell a story – both of which can help users to understand a topic and make decisions. This includes selecting a chart type that fits your data and the message you want to convey with and about your data. You will want to think about the graphical elements, who would see it and where (e.g. on a desktop browser or on small screens, such as a mobile device). But you will also need to think about the type of font you use, if you use icons or not, the colour choices and if they are readable but also if they convey a message. You should consider the axes and scales you use in the chart and how to label them. The issue of legends and annotations and whether people can actually read and make sense of what you created is important too. As is thinking about whether your users could face constraints, such as physical ones (e.g. colour blindness) or in terms of skills (e.g. avoid technical terms) or of bandwidth and screen size (e.g. avoid large charts that require scrolling or interactive visualizations that don’t convey the message when it does not load fast enough).
Avoid chart junk
Chart junk describes all visual elements in charts and graphs that are not necessary to comprehend the information on the graph, or that will otherwise distract the viewer from this information. This means avoiding graphical excesses that don’t ‘respect’ the data and the audience. The visual layout should help to deliver the message and should contain the minimum amount of elements on a chart necessary to achieve this. So when you have chosen the data, the message and a chart type, review the visualization and see if you can reduce unnecessary lines, background images or elements. You can use custom styles and shapes to make data easier to understand at a glance, in ways that suit users’ needs and context. Explain your charts, bars and indicators well, e.g. by labelling your axes clearly and to the right amount of detail – for instance by providing units of measurement. Think about the language your audience is most likely to understand and don’t forget that communicating things as easily as possible includes the largest range of users to consume your content. Avoiding unnecessary complex words is also a way to reduce chart junk.
Design a dashboard if your story is more complex
If you want to display a series of multiple charts you can design a dashboard. As we said before, you should keep your visualization as simple as possible. That’s why separate but connected charts can sometimes better tell a story than one complex chart. Dashboards are often used to monitor changes in data (for more guidance on dashboard design, see Stephen Few’s Information Dashboard Design). A good dashboard can contain different types of charts, such as bars, time series or indicators presented in an aesthetically pleasing way that strikes the right balance between keeping things tidy and simple but providing valuable insight (see https://datavizproject.com/ for an overview of the data visualizations commonly used for this purpose).
This means on a dashboard you’ll need to arrange your content in a meaningful and effective way. Prioritize the most important information using layout structures. Research that tracks how users navigate on a website has revealed that people associate different levels of relevance and importance depending on where content is located on a page. Users tend to pay more attention to the top-left and centre sections of a screen; your most important visualizations should go here. Material in the bottom-right corner, however, is often considered less relevant. Also make sure that items that are logically close to one another are in proximity on display too, e.g. avoid spreading spatial data all across the screen.
Here are some examples of dashboards for procurement data:
Caption: Example dashboard, Opening up Moldova’s contracts. Progress and challenges
Caption: Example dashboard, Better together: How Ugandans are improving procurement with data and dialogue
A lot more can be said about data visualization and we have compiled more detailed guidelines under https://theybuyforyou.eu/visualizationtool/guideline.html. In the next post we’ll provide an overview of the TheyBuyForYou tool that we’ve been working on as an example of how we have taken these guidelines to heart when working with procurement data.
Elena Simperl is Professor of Computer Science at King’s College London. She leads several projects on TheyBuyForYou, an EU-funded research consortium where she and her team built a cross-European knowledge graph of procurement data alongside a series of interfaces and tools that enable SMEs to realize new procurement opportunities. Elena is also the Principal Investigator of the Data Stories project that develops novel ways for citizens to engage with data in a post-truth society.
Laura Koesten is a researcher at King’s College London. She was a Marie Curie Skłodowska fellow at the Open Data Institute and at the University of Southampton, UK investigating the user perspective in dataset search. She is part of the TheyBuyForYou and the Data Stories project. In her research she is looking at ways to improve Human Data Interaction by studying sensemaking with data, data reuse and collaboration and human factors in data science.
21 Nov 2019: A free hand or a free market? How competitive is public procurement in Europe?
The most value for money in public procurement is linked to a competitive tendering process. This means encouraging multiple bidders to present offers. There are many ways to do this, all of which have a demonstrable effect on value for money of a purchase. In this series of articles, we will explore how competitive the overall public procurement tendering process is for European countries. Data was extracted from Tenders Electronic Daily or TED, one of the many data sources we use for tenders and contracts data. We looked at data over the past three financial years (FY), counted as between 1st April and 31st March.
This first part of a three-part series explores the average response time for tenders. In order to encourage more than just the incumbent supplier to bid, there needs to be enough time for any bidder to submit a suitable response. Failure to do so at best makes the process uncompetitive and at worst makes the process collusive.
Average response time for tenders (3 FY average)
The top five countries who provide the most time for bidders to respond are the Netherlands, Denmark, Serbia, the UK and Sweden.
| Country | Average response time | Trend | TED average |
| Netherlands | 77 days | +37% | 40 days |
| Denmark | 61 days | +33% | 40 days |
| Serbia | 50 days | +23% | 40 days |
| United Kingdom | 48 days | +33% | 40 days |
| Sweden | 45 days | +22% | 40 days |
All five countries have seen improvements over the past three financial years, that is to say the time for response is increasing. Meanwhile, the TED average stands at 40 days and is also improving. The top three: the Netherlands, Denmark and Serbia, are all significantly ahead of average at 77, 61, and 50 days respectively.
The averages for the top 5 are somewhat close to the TED average suggesting that the other side of the average provides between 35 and 40 days. The data generally supports this with only Malta, the lowest, falling outside of that window.
| Country | Average response time | Trend | TED average |
| Malta | 31 days | +11.5% | 40 days |
| Albania | 34 days | -14.3% | 40 days |
| Austria | 34 days | +3.3% | 40 days |
| Slovenia | 35 days | -6.5% | 40 days |
| Romania | 45 days | -1.3% | 40 days |
When we look at the bottom five, 3 have seen response times getting shorter and therefore worse over the past three years. By contrast the top 5 has seen double digit percentage improvement. There is grounds for optimism however: the lowest of the TED European countries, Malta, gives an average of 31 days to respond. This in itself is not generally an unreasonable period of time to respond to a call to tender.
To conclude, in this aspect, European countries on average provide at least a month to respond to tenders which is generally sufficient for all but the largest contracts. In the next part of the series, we’ll be looking at tenders with an abnormally low description and title, another key indicator of uncompetitive tenders.
You can find out more about our research at www.spendnetwork.com or look at our data at https://openopps.com.
Alex Yeung is Manager at OpenOpps and Spend Network. We manage the largest open database of over 20m procurement documents in the world mapped to a common standard (Open Contracting Data Standard). Our database is ever growing as we collect tens of thousands of procurement documents every day from hundreds of sources. We use this data to work with governments around the world to provide better value for money and outcomes for public procurement.
3 Oct 2019: Procurement data visualisation
Visualising the procurement data pipeline
The TBFY project has undertaken a detailed benchmark study of the state-of-the-art in procurement data visualisation. This study supports the front-end work that is carried out across several of the project’s main project themes. It aims to guide project partners in their choices of visualisation schemes based on their specific business cases and customer demands. In our study, we provide an overview of the exciting work that is being done in procurement analytics with a strong focus on end-user facing aspects, in particular visualisations. We aim to provide practical support regarding common challenges of presenting a complete, yet compact guide on data visualisation design from established theories and practices. The study also provides updates on the visualisation and interaction work done in the project overall.
What is the status quo in procurement data visualisation?
We have analysed 28 different data portals by starting our search from the website of Open Contracting Partnership (https://www.open-contracting.org/) and then iterated and expanded our search based on the results we found. Portals were designed for specific purposes based on their specific data requirements. Each portal we analysed focuses primarily on relatively few analyses. Some of the approaches under investigation (for example, tenders or contracts divided by different dimensions) are more popular than others and many portals have provided data visualisations to support them. For any type of analysis, several types of data visualisation techniques are available to best support the case.
How can the TBFY guidelines help you communicate insights better?
The TBFY team produces guidelines for project partners to identify the gaps between the analyses that their products support and those supported by the existing procurement data portals. In addition, project partners can use the data visualisation and interaction guidelines to review their current work. Outside the TBFY consortium, the review and guide that we’re putting together can be used as general instructions for dashboard design and for visualisation optimisation, especially in areas with strong focus in analytics.
1 Aug 2019: Business intelligence and blockchain in public tenders: efficiency, transparency and a boost for Spanish companies
At Oesía we believe that process reengineering is an essential pillar of the digital transformation that allows organizations to take full advantage of the potential of ICT for more efficient public services. In addition, process reengineering is a great opportunity to provide simpler and easier to understand public services that help bring administration closer to citizens. This redesign considers that the element of greatest value to an organization is the information available to it. Such an approach allows for better decisions to trigger actions, which requires laying the foundations of data-based processes. Once the information is contained in data, organizations can grow with Big Data, AI and Machine Learning tools. The aim is to automate certain decisions that will facilitate a more agile and rationalized Administration.
These approaches will become a trend in the coming years following a number of high-profile initiatives, such as the Directive (EU) 2019/1024 of the European Parliament, the Council of 20 June 2019 on open data and the re-use of public sector information, the Legislative Resolution of the European Parliament of 17 April 2019 on the regulatory proposal of the European Parliament and of the Council establishing the Digital Europe programme for the period 2021-2027 for the development of artificial intelligence, high performance computer science, cybersecurity and digital skills.
Within the Public Administration contracting context in Spain, with Law 9/2017, of November 8, on Contracts of the Public Sector, through which the European Parliament and Council Directives are transposed into Spanish law 2014/23 / EU and 2014/24 / EU, of February 26, 2014, the efforts are mainly aimed at providing greater transparency, requiring the publication of announcements in the Official Journal of the European Union, in addition to incorporating new options to automate and simplify the public contracting process and introducing new concepts such as the electronic fingerprinting of offers.
This technology and legal framework has generated many opportunities for both public administration and private companies.
In this spirit, Oesía is developing the business case COPIN (Compra Pública Inclusiva, in English Inclusive Public Purchase) as part of TBFY. We are creating a web platform to provide information and analytics of tenders among the EU. The main purposes are:
- To help public administrations improve their efficiency in their procurement processes and results. The information provided will allow a better understanding of the specific markets and communicate how other administrations specify and evaluate similar tenders. Additionally, the platform will provide analytics to help transparency policies of the institutions.
- To support public administration and associations of enterprises, a tool for providing companies tender information with strong searching and analysis capabilities will be made available. This is expected to impact small enterprise business opportunities in particular. While large companies can absorb the cost of seeking and applying for tenders, SMEs are typically locked out of markets, simply due to the high cost of finding the right information. Likewise, SME and large companies can boost sales and extend presence in foreign markets. They can also have the opportunity to connect with other companies and join efforts to present an offer.
For Oesía, this business case means to improve the current offer of ICT services and products designed to empower public administration management, procurement, online services and public policies.
Outside of TBFY but regarding the procurement process, as a case of innovative use, Oesía can provide real experience in the production of public contracting services based on blockchain. In particular, we have developed the service of distributed registry of tender offers and their automated evaluation for the Government of Aragon. With this project, the Government of Aragon aims to explore and take advantage, through a concept test in production, of all the advantages that the Distributed Ledger Technology (DLT) may carry in the field of administrative management and in the concrete application in the relationship with the agents involved in the hiring process, such as bidding companies and citizens. This provides the maximum guarantee of independence, security and transparency, as well as elements that provide a true differential value compared to other technologies – particularly regarding the immutability of records, management based on the identity of private data and the traceability of the entire process.
In addition, this blockchain based project helps to obtain valuable information about the true potential of the DLT with a general perspective. Its application, which is certainly novel today in any field of management, is revealing a whole set of technological or legislative challenges, but at the same time it is enabling us to understand its transformative capacity in a public administration that strives to provide better services that are more efficient, accessible and transparent.
Oesía Networks
15 Jul 2019: ENABLING PROCUREMENT DATA VALUE CHAINS THROUGH A KNOWLEDGE GRAPH-BASED PLATFORM
LAUNCH OF THE TBFY KNOWLEDGE GRAPH
We are happy to announce the first release of the knowledge graph for public procurement, integrating tender and company data.
Public procurement affects organisations across all sectors. With tenders amounting close to 2 trillion euros annually in the EU, it is critical that this market operates fairly and efficiently, supporting competitiveness and accountability. Data-driven insights can help make this happen, supporting buyers and suppliers alike in their procurement decisions.
TheyBuyForYou OCDS ontology visualized with the Protege OntoGraph plugin:
TheyBuyForYou is a three-year initiative bringing together researchers, innovators and public administrations from 5 European countries. It is supported by EU H2020. The aim of the programme is to make procurement data more easily accessible and hence facilitate better decisions in areas such as economic development, demand management, competitive markets and vendor intelligence. To achieve this, TheyBuyForYou leverages a range of data sources which are integrated into a knowledge graph, which is used in data analytics and decision making.
Almost eighteen months into the programme, the team is proud to announce their first release of the TheyBuyForYou knowledge graph, integrating tender and company data. As of the first quarter of 2019, the graph consists of over 23 million triples (records), covering information about almost 220,000 tenders.
The knowledge graph is available as open source and is compatible with standards in the procurement domain:
- OCDS (Open Contracting Standard), capturing tender data throughout the contracting process.
- euBG ontology, developed by the European euBusinessGraph project, providing a common model for company data.
The graph capitalises on data from two market leaders in their fields: OpenCorporates (for company data), and OpenOpps (for tenders and contracts, including the Tenders Electronic daily – TED – data feed).
Dr. Ahmet Soylu, SINTEF Digital (technical manager):
“Government spending processes need data and tools that enable transparent decision making. The TheyBuyForYou knowledge graph constitutes an important step in the right direction and may become the core model for future procurement data ecosystems.”
Prof Oscar Corcho, Universidad Politécnica de Madrid (knowledge engineering expert):
“Governments and public entities must deliver transparent services in the face of reduced budgets, while preventing losses through fraud and corruption. The TheyBuyForYou knowledge graph provides an appropriate response to these challenges.”
Dr. George Konstantinidis, University of Southampton (data management expert):
“Managing, integrating, interacting with and providing analytics on top of procurement data is dependent upon reliable and well-designed data infrastructure. The TheyBuyForYou knowledge graph is a coordinated effort to achieve these goals.”
Ian Makgill, OpenOpps (govtech entrepreneur):
“We are very happy to see our data feeds and APIs integrated in the TheyBuyForYou knowledge graph. We hope that more data providers and consumers will adopt this technology, which can become an extremely useful channel to reach new customers and develop business models for procurement related data assets.”
Prof Elena Simperl, University of Southampton (knowledge engineering expert):
“Knowledge graphs bring together data from a variety of sources into a common format that can be easily extended and reused by organisations. By releasing the graph open source we hope to encourage developers to use it in their own products and give us feedback on how we could improve it.”
Find the knowledge graph at https://github.com/TBFY/knowledge-graph
1 May 2019: TBFY First Hackathon – Alan Turing Institute in London, 8-12 April 2019
The TBFY project partners held their first hackathon at the prestigious Alan Turing Institute in London in early April 2019. The hackathon was run by a wide range of leading academics from the University of Southampton, the University of Manchester and the University of Oxford, among others. Spend Network provided access to hundreds of thousands of tender notices from the UK and overseas to give researchers the opportunity to explore ways of matching businesses to government contract opportunities. It is one of TBFY’s key objectives to make the procurement market more accessible and more transparent, which made this a particularly exciting event.
The project partners invited programming wizards with skills in text mining, natural language processing, recommender systems, modelling with structured data records, semi-supervised learning, dashboard visualization and familiarity with EU or UK tenders to this one-week event in central London.
The approach that the team decided to pursue consisted of building vector representations of suppliers and tenders to identify their compatibility with the distance between the respective vectors. In building their representations, our data specialists made use of both their textual descriptions and knowledge of previously awarded contracts.
One of the key outcomes of the experiments over the week is that previous contracts are informative of future procurement decisions. This demonstrates just how important transparency and openness are for the tender and procurement process. The best results of the week-long efforts used correlated topic models for extracting representations of textual descriptions.
Yuchen Zhao from the University of Southampton represented the TBFY community at this hackathon and contributed a full report for the Alan Turing Institute which can be found here.
19 Mar 2020: Public International Trade Opportunities: How OpenOpps is making data more accessible for you
At OpenOpps, we have been working with our partners They Buy For You on an exciting new Public International Trade Opportunities (IPTO) project. The outcome of this project is to provide a single point of access for data, available to people all around the world.
The first stage is to manage the data that will be used as an input for the enrichment and publication process in future stages of IPTO.
We began this work in a strong position, with a database containing tender notices and contract data from across Europe, mapped to the Open Contracting Data Standard format. But we wanted to do more…
Redesigning the way we collect our data
To improve the reliability of our data collection, we have redesigned our scripts. We programmed code that collects new publications from websites publishing contracts and tenders. Now they can run independently from each other, decreasing the chances of failure across the data collection process.
In addition, this improves our ability to log the activities of our scripts. Now, for each source, we have a far better understanding of how our data collection efforts are running and performing.
Consequently, our new collection methods mean we can now offer partners an online tool to monitor script outputs every day.
Expand our data sources
Working in partnership, OpenOpps and our partners at TBFY have identified key data sources from around Europe. After assessing their suitability for the project, we created accurate scripts to collect data from these. Now we have data for Spain, Italy, the UK and France.
We have also redesigned how we process data from TED, a website dedicated to European tenders and procurement, and our contract collection scripts for TED. Following this, we can now collect even more data formats, without missing any nested contracts, multiple contracts awarded against a single tender.
At the end of this first stage of the project, we have successfully expanded the data collection required for the project. We now publish daily, on average, more than 26,000 tenders from Europe, over 200% more than our previous data gathering.
The future…
Still we want to do more. We want to keep expanding the number of data sources and to be able to better evaluate economic development opportunities from public procurement. In short, we want to keep opening up public procurement, to make it more accountable, better value for money and ultimately, fairer.
For more about Open Procurement Europe.
28 Jan 2019: Optimise your vendor management process
Cerved is an Italian leader in business information, and a truly data driven company – our data patrimony enables us to offer high added value services to our clients. Some of our core businesses include credit information, ensuring protection of businesses against credit risks, as well as marketing solutions offering new business opportunities to companies.
Recent innovations in digital transformation have greatly influenced the purchasing division of companies with requirements to further increase efficiency in managing supplier portfolios. The first key step in successful supplier management includes knowing your suppliers (i.e. financial stability, ancienty, the workforce, existing insolvencies, amongst others). Cerved with its rich data patrimony, continuous new data sourcing, integration and harmonisation, and growing ecosystem of APIs is well placed to answer this need for the Italian market.
In the scope of TheyBuyForYou Cerved is developing various indicators for supplier risk monitoring as supplier stability is crucial for the vetting and procurement decision process. To this end Cerved is relaying on it’s rich data patrimony including procurement notices data. Cerved is also developing a set of services that can be easily integrated in 3rd-party supplier monitoring and spend management solutions. These include:
Supplier profile enrichment
Providing rich profiles for the tender participating companies, including their main business, products, website, past tender history, dimensions, revenue, entities, territory presence and employees.
Risk Mitigation
Identifying potential collusive tendering by discovering hidden connections between several participating companies within a tender call. We rely on large databases of proprietary Chamber of commerce data, collected open data including historical tender information and third-party data sources. Existing links between company shareholders and managers are cross-matched with links between companies, sharing properties and tender co-participation.
Ranking
Procurement managers might have different preferences for ranking potential suppliers. This ranking might not only be based on the price – they might be more interested in financial stability and other dimension for ensuring robust supply chains or in the geographical position for logistics. This service will support supplier ranking based on various indicators, such as the innovation capacity of the company, website visibility, underlying website technology, dimensionality, news presence, amongst others.
Supplier Discovery
Frequently buyers are not happy with how the existing suppliers are answering their e-procurement needs. This service will propose and offer information on potential suppliers that could answer the e-procurement need based on co-participation in past tenders, website content, as well as other indicators.
28 Jan 2019: Making a business case for reconciliation
Knowing who we and our governments do business with matters. In most developed countries, government procurement is a fairly hidden process. This lack of oversight isn’t just a problem in terms of access to information – it also excludes small businesses from the procurement process, distorting the market against them..
In order to understand a company – for procurement or other purposes – businesses and organisations often need more information about entities than what is available in company registers. This means enriching this information with data from other sources. Doing so is actually a lot more difficult than you might imagine. For example, is OpenCorporates Ltd the same as OpenCorporates Limited? Doing this across jurisdictions is even more tricky. This process of matching references to companies to canonical records of them is known as ‘reconciliation’, or ‘entity resolution’.
For example, an SEC 10-K filing (an annual report with a comprehensive summary of a company’s financial performance) may include information about the company’s subsidiaries, and perhaps jurisdictions. In order to be useful, users need to be able to match the information in this non-company register data to the 160 million plus companies in OpenCorporates.
Whether you are a stakeholder of a company, a financial services company, a start up, a public sector body, a journalist, NGO, corporate investigator or law enforcement, easily finding references to companies and matching these against the legal entity is crucial.
OpenCorporates already has this functionality via our OpenRefine API – but we want to make this faster, add more functionality, and improving the matching. We’re carrying this out as part of our work with the EU Horizon 2020 project TheyBuyForYou. We will be enhancing our reconciliation service using both some simple improvements, alongside advanced technologies. We’ll be blogging more about this as the project progresses.
Amongst the areas we’ll be looking at will be matching against additional attributes such as addresses, handling abbreviations, punctuation and typos, and creating a new scoring mechanism for matches, and allowing users to configure the strength weighting to different pieces of data e.g. placing more weight on company number. We’re also OpenCorporates committed to increasing the number of EU Member States for which we have company register data.
The end goal is that reconciliation will be transparent, user friendly and matches will be made against open, clean and quality assured OpenCorporates data.
28 Jan 2019: Public International Trade Opportunities: An OpenOpps Project
What is ‘Public International Trade Opportunities’?
‘Public International Trade Opportunities’ (PITO) represents our vision to open up global public sector tenders and contracts of world. We want to provide access to this information to taxpayers, suppliers, journalists, government organisations, NGOs and academic bodies around the world.
‘Public International Trade Opportunities’ in practice
At OpenOpps we currently collect over 26,000 tender documents a month from over 720 different public sources around the world, without any need for human intervention.
We collect data from over 100 countries, gathering their tender notices, contract notices and specification documents. These documents are all converted by us to the Open Contracting Data Standard JSON format (OCDS). At the time of writing we have over 10.3m documents in our database, making it the largest OCDS repository in the world.
By turning this data into a collective register of government demands across the globe, we know what is bought by whom.
Our product; your product
We make open tenders freely available to search through our website https//:openopps.com, at the time of writing you can search over 100,000 open tenders through our site. All of our data is also available through our API. We also have a subscription web service that provides advanced search, additional data and downloads.
How we get the data and what we do with it
Our technologies
The technologies that we use are open source, including our database, search engine, web framework and charting tools, so they can be deployed without limitation.
Where we sit in ‘They Buy For You’
Our data is trusted by our partners in ‘They Buy For You’ (part of the European Commission’s Horizon 2020 program): OESIA, Cerved, UPM, SOTON, JSI and MJU and underpins the program as a whole. Our data is also being used by the UK Government, the European Union and multiple blue chip companies. We are also working with Academic institutions, including the Alan Turing Institute.
7 Sep 2018: Why are public tenders becoming less competitive?
Worrying new research by TBFY partner Openopps, shows that public tenders across Europe are becoming increasingly uncompetitive, with 25% of tenders receiving only one bid. Of concern is that the trend toward uncompetitive single-bid tenders is increasing – by 44% between 2016 and 2017. The total estimated value of these uncompetitive contracts has grown from €41trn to more than €100trn* in the same period.
Falling bids, average bid numbers for tenders across Europe. (Source: data extracted from ted.europa.eu).
The lack of competition is also shown by the average number of bids being posted by suppliers for each contract. In 2012, the average number of bids for each tender was nearly four, in 2018 the average number of bids has been less than three, a fall of 27%. While this may appear to be good news for lone bidders, uncompetitive tendering does not deliver good value for consumers, and is a possible indicator of cronyism.
But why are we seeing this movie from highly competitive towards less competitive tenders?
We don’t yet know, but a significant ambition at TheyBuyForYou is to apply cutting-edge analysis and to open procurement data to gain improved insight into underlying causes of this and other undesirable supply chain phenomena. With greater computing power available to us, we’re able to draw correlations between low numbers of bids and key attributes of the tenders being published.
For instance, we already know that there is an inverse correlation between the falling average number of bids and an increase in the value of a contract (see chart below). However this correlation is less pronounced than we would expect. We also see a similar inverse correlation between the number of single bids and the value of a contract.
Average numbers of bids by thresholds of contract value, 2012 – 2018. (Source: data extracted from ted.europa.eu)
Future analysis could look at whether the amount of work required to respond to a tender is a factor, or whether the quality of the language used in tender documents correlates to poor response rates. We will also look at the timings of tender responses, looking not just at the time provided to respond to tenders but also when tenders are published, such as during popular holidays like Christmas.
This is just the very beginning of our research, our aim is to use the data that we gather to highlight where problems are occurring and suggest remedies that European governments may adopt to improve their procurement. From clear insights on how to attract suppliers to bids and potentially providing early warning of bids that may prove to be uncompetitive, we aim to provide a suite of tools and mechanisms that will improve the efficiency of public markets across Europe.
However, the data we can extract from these public notices is often poor and data on contracting is particularly inconsistent. In order to develop the tools that can resolve some of these pressing issues, we will have to undertake significant work on improving and augmenting this data. Our aim is to apply improved analytical techniques to not only understand what is driving the rising lack of competition, but also to provide Governments with tools and analytics that will reverse that trend.
For further information on this issue please see OpenOpps founder, Ian Makgill’s blog post.
* All analysis was conducted using the TED data (ted.europa.eu).
31 Aug 2018: Oesía: helping to boost the impact of SMEs
Some of the Information Society publications and analysis supported by Oesía.
Through their significant role in developing public administration services Oesía are closely aligned with Spanish government initiatives to boost the economic development and competitiveness of micro, small and medium enterprises (SMEs) through adoption of new technologies. It is this unique insight that Oesía bring to our project. Their key role will be to contribute their considerable technology and know-how to develop, evaluate and promote the Inclusive Public Purchase information platform. This is one of the key deliverables of our project which we expect to have a significant impact on the development of SMEs as well as public administrations.
Opening tenders to SMEs
While large companies can absorb the cost of seeking and applying for tenders, SMEs are typically locked out of markets, simply due to the high cost of finding the right information. To counter this, our platform will provide access to European public tenders via a single website, allowing everyone to search for proposals. This ground-breaking approach will enable fair and equitable access to public content providing immense economic and social benefit to all – from large, multinational businesses, to the smallest SME.
A key benefit to larger companies that currently hire information services will be the ability to access public tender opportunities in a more centralised, focused way. By incorporating new search capacities, including the adoption of knowledge graphs, ontologies, and open data, our platform enables the highest possible specificity of requirements and conditions. Among other features, our platform will also facilitate potential collaborations between SMEs and larger companies, thereby enabling optimal combinations of offers. In short, a clear impact is expected on the inclusion of the SME in public procurement processes, resulting in global economic development.
From the point of view of public administrations, the Inclusive Public Purchase platform, will add depth to our understanding of markets through the analysis of awarded contracts and their specifications. This will result in better purchasing decisions and increased efficiency in public management while also improving transparency and access to open data, thereby contributing to the impact of SMEs.
In addition to developing the Inclusive Public Purchase platform, Oesía are also bringing their substantial knowledge and experience to the development of our Spanish public sector business cases (Work Package 6), and will provide IT services and consultancy to our exploitation strategy (Work Package 7).
About Oesía
Oesía enterprise are part of Group Oesía, a leading Spanish technology company offering IT consultancy and managed services. Evolving from the foundation of Technobit, in 1976, and headquartered in Madrid, Group Oesía is a large company established throughout Spain and 23 other countries, employing a staff of more than 3,000 worldwide.
Regional government tender and electronic auction portal, developed with OESIA’s @djudica platform.
The public sector consultant team at Oesía specialise in public procurement, open government, cyber security, innovation, economic management, administrative procedure, regulation, legislation, and European funds management. They lead services and development of a variety public administration services, including Interpública (since 1995, they have provided public administration accounting and transparency services for more than 1200 municipalities), the @djudica tender and electronic auction portal, and the citizen participation platform, NEXO.
NEXO platform: OESIA’s product for citizen participation.
The background to Oesía’s participation to our project was through their development of a Contracting Ontology for the public sector – part of the Spanish governments’ CONTSEM Project (Optimization of public procurement through the use of semantic techniques). The result of this experience was the PPROC ontology, which is used in their bidding processes by Huesca County Council, the Government of Aragón, as well as other public institutions including fellow TheyBuyForYou project partners Zaragoza City Council. PPROC is also the ontology recommended by AENOR in the UNE 178301 Smart Cities standard: Open Data.
Oesía’s Office of Evaluation and Studies has carried out evaluations and impact assessments of various public programs included in the Digital Agenda for Spain. Many of them were associated with Objective 2: developing the digital economy for growth, competitiveness and internationalisation of Spanish companies. These activities are undertaken by the Public Business Entity Red.es, and are aimed at micro enterprises and SMEs.
These businesses are based on ICT (Information and Communication Technology) advice, e-commerce, digital marketing, connectivity, cloud computing, management systems and equipment, amongst others. including public programs aimed at enhancing both the supply and the demand for ICT in SMEs. The encounter between ICT supply and demand for sustainability and the digital transformation of SMEs is considered a key factor. In this sense, actions that facilitate bringing the demand of the public sector closer to SMEs, such as the TheyBuyForYou project, will generate a pull effect on the supply of SMEs, enhancing their growth.
In the line of good practices for ICT public policies in Spain, it is worth noting the leading role of Red.es in developing impact evaluations of its programs to understand the degree of compliance with the set objectives. This is done in order to understand the efficiency and effectiveness of its actions, and to improve the design and execution of future programs.
Oesía have been engaged with the efforts of public administration and SMEs to increase core ICT competencies and bridge technological gaps, with the ultimate goal of growing and promoting Spain’s economic development. This is especially important when we take into consideration that most Spanish business are SME’s with fewer than 200 employees. Oesía’s support of ONTSI (The National Observatory for Telecommunications and the Information Society) in monitoring the use of ICT by Spanish companies, has allowed them to develop a deep understanding of the barriers and opportunities that arise for these enterprises.
14 Aug 2018: Best practices in public procurement: open data and transparency at Zaragoza City Council
Plaza del Pilar, Zaragoza/Gregorio Puga Bailón/ ©2015. CC BY 2.0
Project partners, Zaragoza City Council are at the forefront of publishing and managing open data on public procurement, and are working towards full electronic management of public contracts. Their involvement with They Buy For You includes:
- Improving the visualisation of public procurement
- Defining a dashboard
- Improving performance in detecting data errors, and combating fraud.
For more than 10 years Zaragoza CC have published tender calls, award notices and contract notices on its Buyers Profile web site. As early as 2008 they adopted advanced methods, like time stamping – ensuring access, integrity, availability, authenticity, confidentiality, traceability and data preservation. In recent years they have published more in-depth contract data on the site, including information from Minor Contracts.
Open Public Contracting Data
Catalogue of Open Data, Zaragosa City Council ©2018
Zaragoza CC coordinates the Public Procurement Working Group of the W3C Spain Open Data community. Since 2013 the Council has worked closely with similar and like-minded organisations to establish agreed protocols on the publication of its Buyers Profile dataset. In order to encourage reuse of their datasets by businesses, citizens, and other stakeholders, it was agreed to adopt open data standards, as well as systematic monitoring of public procurement, and the development of studies.
Access to the catalogue of open data allows citizens to find out how to reuse information. It includes examples of SPARQL queries, access to the ontology, and other useful guidance.
An ontology for public procurement
Since 2015, all the contracts managed by the City Council have been labeled semantically, using the PPROC ontology. This includes minor, open and negotiated contracts, both for work and services and supplies. These contracts can be consulted through the Buyers Profile and through Zaragoza’s open data catalogue, in different formats.
Current services
Contracts
Spanish procurement law requires the publication of announcements and specifications related to a tender exclusively on its Public Sector Contracting Platform. This means that only a link to the platform is published on the Zaragoza CC.
Latest Updates
Direct access to different announcements are available in chronological order.
Contracts Search
Access and filter current and historical tenders, by contract status, record, contracting entity, type of contract (work, service, supply), among other criteria.
![]()
Transparency Indicators, Zaragosa City Council ©2018
- Awardees
Successful companies that have participated Zaragoza City Council’s call for tenders since 2014. - Bidders
A list of companies that have participated in tendering processes. A page for each company is shown, indicating the number of contracts that have been tendered, the amount obtained and the breakdown by years. - Management services
A list of Management Services for the contracts formalised by the Zaragoza City Council. - Data totals
Amount and percentage of formalised contracts, and steps followed by a formalised contract.
Automatic updates in the Spanish Platform for Public Contracting
Zaragoza CC has mapped PPROC contracts with CODICE (the set of XSD schemes used by the Spanish Public Sector Contracting Platform) in accordance with the procedures and requirements of Directives 2014/23/EU; 2014/24/EU; 2014/25/EU; 2009/81/CE and the Spanish regulations on public procurement.
Next steps
The They Buy For You project enables Zaragosa CC to continue to develop their services, with the following objectives:
Improving existing services for the visualisation of public procurement.
Enriching information on contracts through the use of services developed in this project, and making the most of the project partners’ experience to improve the user experience of these visualisations. In this way, Zaragosa CC will be able to reduce the time/effort required to solve public information requests, optimise the economic proposals of the tenderers, and facilitate the analysis of contract costs.
Defining a dashboard – with indicators related to contracting, economic information provided by project partners and improving transparency.
Developing services for our departments that assist their contract supervision and management work. This will be achieved by producing technical reports which focus on the fight against fraud, quality of data (error detection), and ultimately, improving efficiency.
1 Jun 2018: TBFY partners gather
TBFY partners enjoy the spring sunshine between workshop sessions at Bled, Slovenia.
As our project continues to build momentum we gathered for our second plenary meeting on the 8th and 9th May in Bled, Slovenia. Our agenda focused on progress made over the first 4 months of They Buy For You and plans for next steps. We’ve achieved some key milestones so far. These include scoping procurement open data sources and APIs, collecting information to create engaging business cases, and developing data visualisations. So far we have identified around 150 relevant data sources which will be extracted, normalised and ingested into our developing toolset over the coming months.
See our Twitter story on Wakelet.
It’s still early days, but significant progress has been made, with partners are set to meet again in mid-September in Spain. To follow daily updates on the many aspects of our project, including our developing knowledge graph, how we manage datasets in different languages, and contracting data, please visit and connect to our Github repository.
They Buy For You is an EU Horizon2020 project using open data to build tools for better and fairer procurement, with the aim of stimulating growth in European data companies, saving €billions in public spending, and combating corruption in the tendering process.
20 May 2018: Safety in procurement
Procurement is a huge business which affects virtually all sectors and organisations. In the public sector alone, spending on goods and services across the EU is estimated at more than €2 trillion per year.
But there are many challenges. Governments and state-owned enterprises are confronted must deliver services with greatly reduced budgets; prevent losses through fraud and corruption; and build healthy, sustainable economies. Managing these competing priorities at a national level and across many disparate agencies is notoriously difficult. Coordinating them across Member States seems almost impossible, and the development of vibrant, competitive economies without access to data and tools is problemmatic.
In times of enhanced transparency and accountability, there is a pressing need for better insight into, and management of government spending. Too often, the same suppliers are given contracts without considering the total, longer-term benefits to the government’s bottom line or the broader implications of tendering decisions in terms of employment and skills development. At the same time, we struggle to identify fraud in public tendering; the OECD estimates that more than 82% of these cases remain undetected across all OECD countries, while recent research puts the costs of corruption in EU public tendering as high as €990b a year.
Private sector procurement faces similar challenges. Decision makers are expected to deliver the best possible value and to run efficient and accountable tendering procedures, whether the beneficiaries are company shareholders or taxpayers. While the process tends to be less structured than in the public sector and decisions and framework conditions are not subject to public scrutiny. However, these decisions should be transparent internally, and they should demonstrate best value for money. Facilitating this becomes increasingly difficult as the global flows of goods, services, finances, and people reach levels unimagined a few decades ago.
In this environment, They Buy For You are using open data to build tools for better and fairer procurement. Over the coming years we aim to assist SME’s and public organisations, stimulate the growth of data companies, save €billions in public spending, and help to combat corruption in the tendering process.
30 Apr 2018; Innovation scenarios, business cases and objectives
TheyBuyForYou explores how procurement and public spending data, paired with data management, analytics, and interaction design, can be used to innovate four main areas:
- Economic development: Delivering better economic outcomes from public spending, in particular for SMEs. SMEs should be able to get better access to public tenders, competing with more established players.
- Demand management: Spotting trends in spending and supplier management to achieve long term goals such as cost savings and efficiency gains.
- Competitive markets: Identifying areas for cost cuts through healthier competition.
- Procurement intelligence: Producing advanced analytics to inform decision support, risk monitoring and supply market analysis for procurement and purchasing managers.
To achieve this we are building a new technology platform using public spending and corporate data from a wide range of sources in Europe. Our platform comprises Web-based services and APIs that will publish, curate, integrate, analyse, and visualise a comprehensive, cross-border and cross-lingual procurement knowledge graph.
We are also supporting our four innovation scenarios through the building of an online toolkit and a public portal. This will enable everyone – suppliers, buyers, data journalists, data analysts, public authorities and all citizens – to explore and understand how public procurement decisions affect economic development, efficiencies, competitiveness and supply chains.
For private buyers looking to overhaul their procurement and purchasing decisions, we will deliver vendor intelligence solutions with advanced analytics capabilities. These will provide the ability to monitor risk, support decision making, and identify potential collusive tendering.
Our technical vision will be realised in three business cases, aimed at the main customers for procurement services. Two business cases will be with public administrations at the national and local levels in Spain and Slovenia. These will demonstrate how new data value chains can make processes more efficient, while in the same time fostering economic development and restoring fairness and true competition in the supply market. The third business case will result in a new commercial product, developed by TBFY partner Cerved, for decision makers in procurement and supplier management.